Introduction
This guide describes how to calculate OEE.
Simple OEE Calculation
The simplest way to calculate OEE is as the ratio of Fully Productive Time to Planned Production Time. Fully Productive Time is just another way of saying manufacturing only Good Parts as fast as possible (Ideal Cycle Time) with no Stop Time.
Therefore, the calculation is as follows:
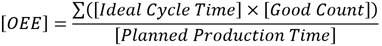
Although this is an entirely valid calculation of OEE, it does not provide information about the three loss-related factors: Availability, Performance and Quality. To include these factors, a more detailed calculation is required.
Detailed OEE calculation
The detailed calculation is based on the three OEE factors: Availability, Performance and Quality.
OEE is calculated by multiplying the three factors:

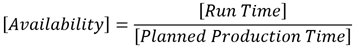
Availability
Availability considers all the events that stop the machine from producing. This can either be unplanned or planned events.
The events are only tracked if it makes sense to track a reason for downtime (typically several minutes).
It is calculated as the ratio between [Run Time] and [Planned Production Time].
Planned Production Time
The [Planned Production Time] is the time the machine is expected to produce.
It is calculated by taking [All Time] (24/7/365) and subtracting the [Scheduled losses] (time where the machine is not expected to produce).

Run Time
The [Run Time] it simply the [Planned Production Time] without [Stop Time].
[Stop Time] is a sum of all [Unplanned Stops] (e.g. breakdowns) and [Planned Stops] (e.g. changeovers).


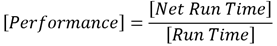
Performance
Performance considers anything that causes the manufacturing process to run at less than the maximum possible speed when it is running (including both Slow Cycles and Small Stops).
Performance is the ratio between [Net Run Time] and [Run Time].
Net Run Time
The [Net Run Time] is a sum of all manufactured parts multiplied by the [Ideal Cycle Time] for each production.
Because each manufactured part can have a different [Ideal Cycle Time] (e.g. different products), the calculation needs to take this into account.

Ideal Cycle Time
Ideal Cycle Time is the fastest cycle time that your process can achieve in optimal circumstances. This can be different for each product.
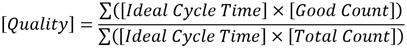
Quality
Quality considers manufactured parts that do not meet quality standards, including parts that need rework.
Please note that OEE Quality is like First Pass Yield, in that it defines Good Parts as parts that successfully pass through the manufacturing process the first time without needing any rework.
This is the same as taking the ratio of Fully Productive Time (only Good Parts manufactured as fast as possible with no Stop Time) to Net Run Time (all parts manufactured as fast as possible with no stop time).

Why the Detailed OEE Calculation?
OEE scores provide a very valuable insight – an accurate picture of how effectively your manufacturing process is running. And, it makes it easy to track improvements in that process over time.
What your OEE score does not provide is any insights as to the underlying causes of lost productivity. This is the role of Availability, Performance and Quality.
In the preferred calculation you get the best of both worlds. A single number that captures how well you are doing (OEE) and three numbers that capture the fundamental nature of your losses (Availability, Performance, and Quality).
Here is an interesting example.
Look at the following OEE data for two sequential weeks.
|
OEE Factor |
Week 1 |
Week 2 |
|
OEE |
85.1% |
85.7% |
|
Availability |
90.0% |
95.0% |
|
Performance |
95.0% |
95.0% |
|
Quality |
99.5% |
95.0% |
OEE is improving. Great job! Or is it?
Dig a little deeper and the picture is less clear.
Most companies would not want to increase Availability by 5.0% at the expense of decreasing Quality by 4.5%.