Introduction
- This guide describes how to use the subscription site. A subscription is used for receiving reports via emails about the OEE data and other types of reports at a regular interval.
Setup
Go to the "Subscription" menu.
Overview
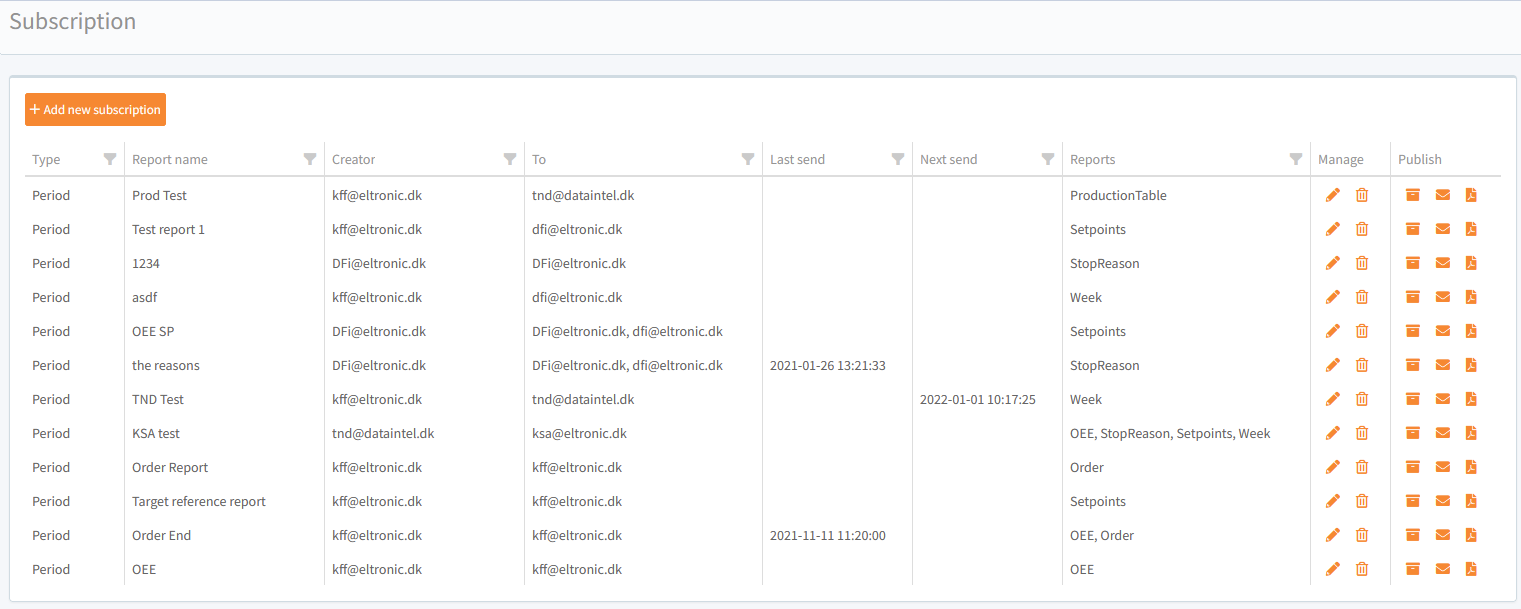
The following information is presented on a subscription:
- Type: The type of the subscription.
- Report name: The report name of the subscription.
- Creator: The user who created the subscription.
- To: The users the reports are mailed to.
- Last send: The last time a report was mailed.
- Next send: The next time a report will be mailed.
- Reports: The report types that a report will include.
Create a subscription
Click the "+ Add new subscription" to go to the subscription creation page.
Provide the following information to setup a subscription:
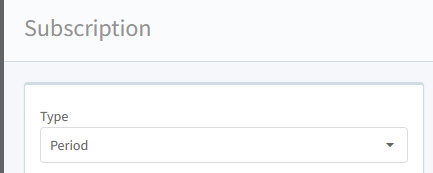
Type:
Select the type for the subscription, this is for when the reports should be mailed. There are the following types:
- Period: The report will be mailed at a regular interval(see Recurrence for how to specify this interval).
- Order end: The report will be mailed when a order has ended.
- Shift end: The report will be mailed when a shift has ended.
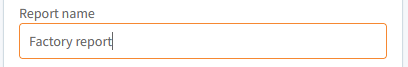
Report Name:
Give a name for the report, this subscription will mail.
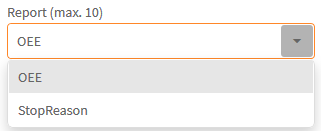
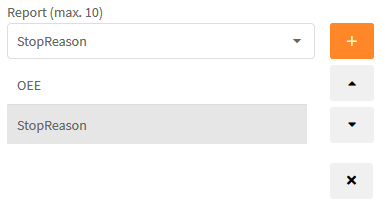
Report:
Here you can add the report types that you want in the mail.
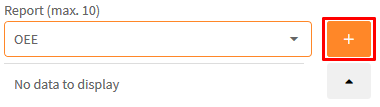
Select a report type:
Click the "add" button.
Click the added report type in the list:
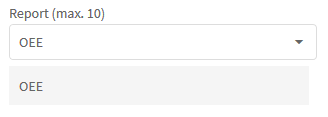
Now, a new set of input fields should have appeared.
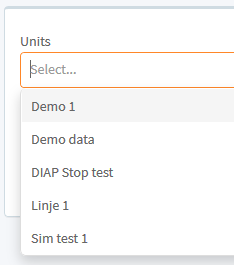
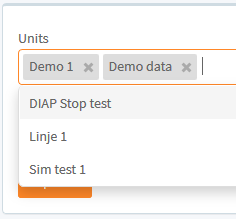
Unit (Only if Type is set to Period):
Select the units that the report type should include.
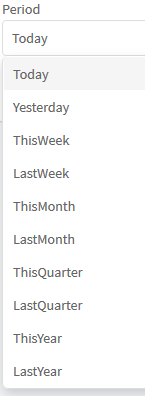
Period (Only if Type is set to Period):
Select the period that the report type should cover.
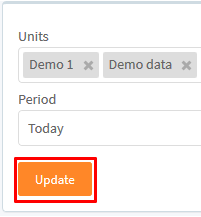
Click the "Update" button to update the setting for the selected report type.
If you have added the wrong report type, you can remove it by selecting it on the list.
And click the remove button.

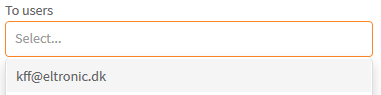
To users:
Select the users that this subscription will mail the report to (It is by design that only registered users in the system can be selected).

To External Emails:
External emails are emails, that are not tied to a user in the users list on the live site.
This list of external email, can be found on the live site under Settings, click tab Editors and select Email under list to edit:
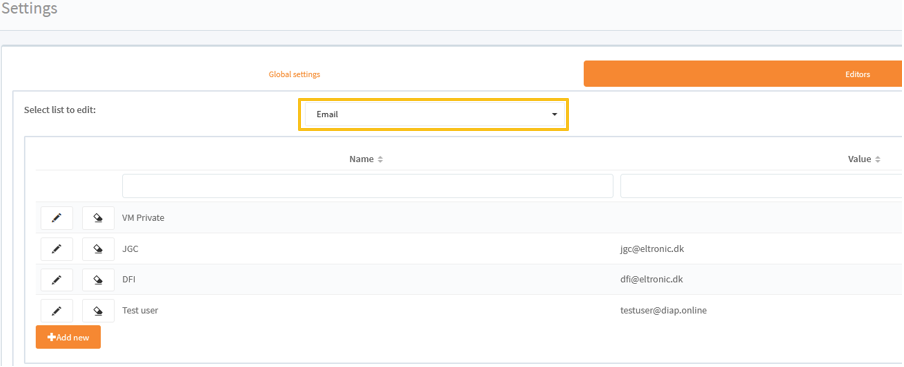
Select the emails (that are not a user) which should also receive the email:
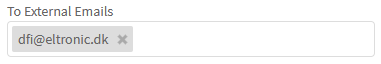
Please note that an email address must be specified. I can be either the "To user" or an external email address.
Comment (optional):
You can provide a comment for the report.
Start datetime:
Provide the date and time that this report should be mailed.
Note:
The date and time you see here is in your browser's timezone. All the "to users" will receive the report about the same UTC time. For example, you are in Denmark (UTC+01:00) and you select yourself and a co-user who is in England (UTC) to receive the report. If you set the time to 12:00, then you will receive the report at 12:00 local time and he will also receive the report at the same time, but his local time will be 11:00.
Unit(Only If Type is set to Order end):
Select the unit, that the report will cover, when an order ends.
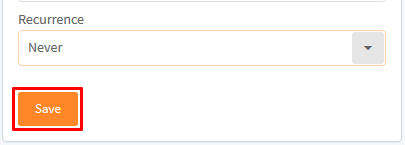
Recurrence(Only if Type is set to Period):
Provide how often a new report should be sent.
- Don't repeat.
The report will not be sent repeatedly.
- Daily
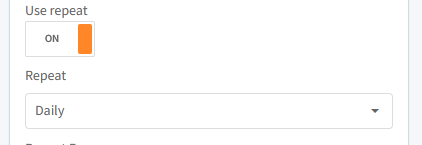
A new report will be daily sent.
You can set how many days there are til the next new report.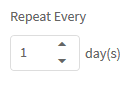
And when to stop sending new reports.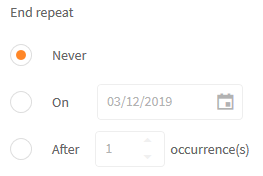
- Weekly
A new report will be sent weekly.
You can select which of the days in the week a new report should be sent.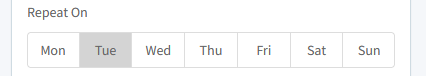
- Monthly
A new report will be sent monthly.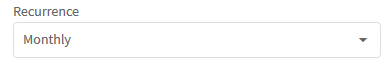
You can set how many months there are til the next new report.
You can set which day of the mouth a new report be should sent.
- Yearly
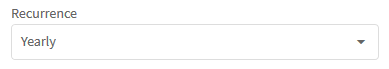
You can set how many years there are til the next new report.
You can set the date a new report should be sent.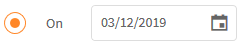
Click "Save" to create your new subscription.
Report types
There are the following report type:
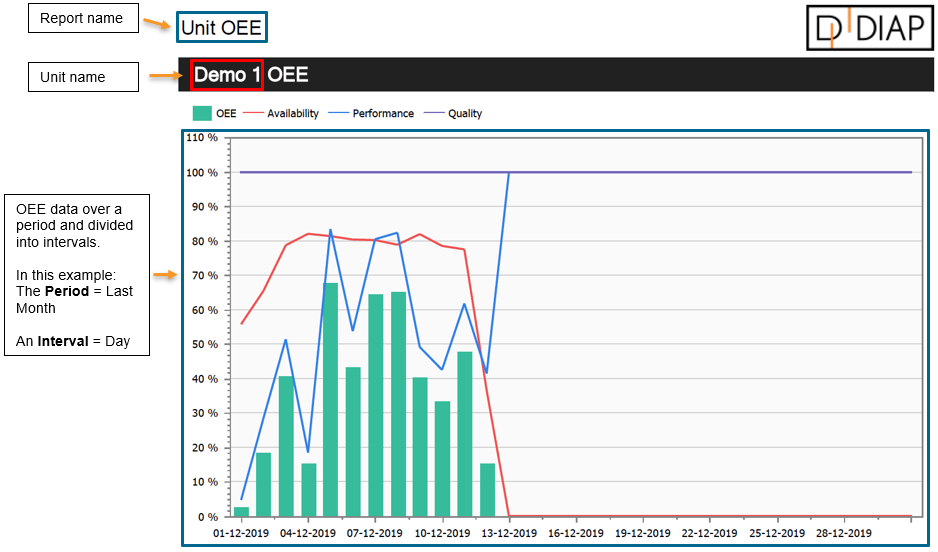
OEE:
This report type provides an OEE graph. It has the following parameters:
- Units: The units that should be included.
- Period: The period that should be covered.
- Interval: The interval, which the period should be split it's data into.
- Include no production: Show the data for the periods, where the period is only in ScheduledLoss.
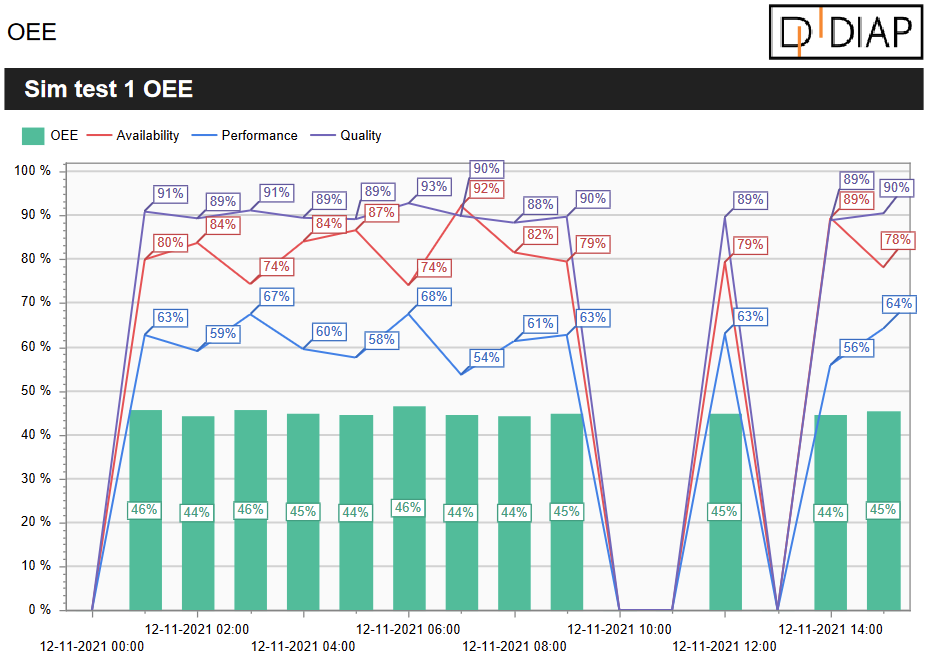
- Show data values: Show the data in labels.
Example of the OEE report:
Example of Show data value:
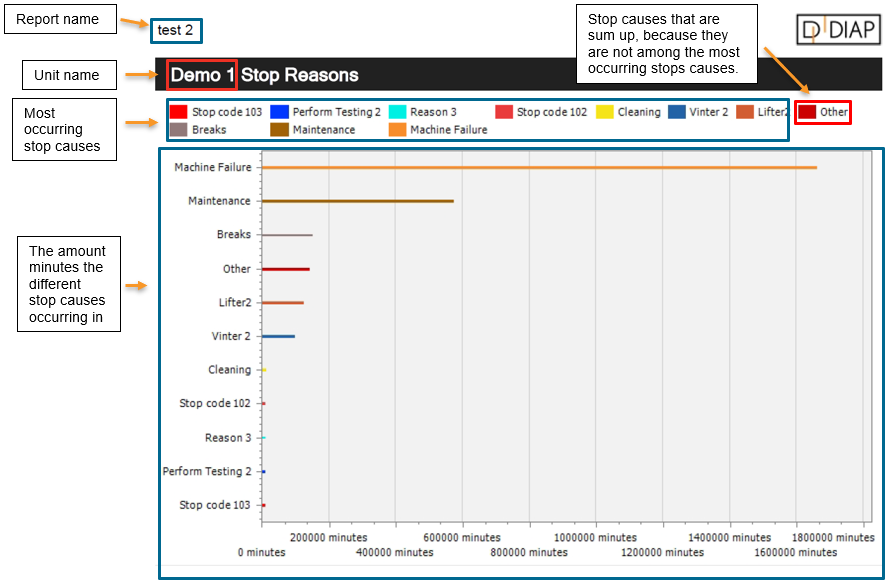
StopReason:
This report type provides a stop category Pareto graph. It has the following parameters:
- Units: The units that should be included.
- Period: The period that should be covered.
- Amount of reasons to show: The number of most occurring different stop causes that will be shown.
- Show data values: Show the data in labels.
Example of the StopReason report:
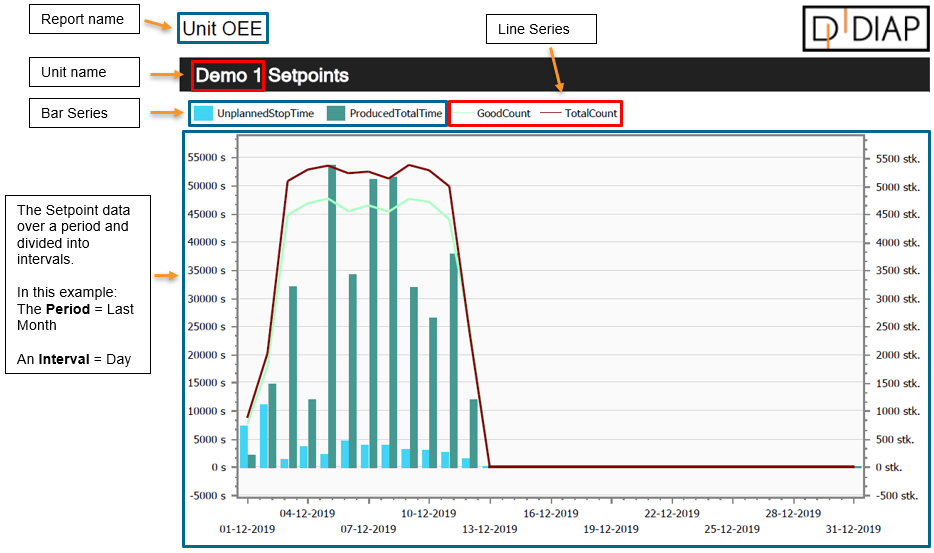
Setpoint:
This report type provides an Setpoints graph. It has the following parameters:
- Units: The units that should be included.
- Period: The period that should be covered.
- Setpoints: This report type provides the underlining data for the OEE aspects. These data are:
- Point:
- All Time: The 24/4 time (including every minute) that is available for the period.
- Scheduled Loss Time: The time that is not scheduled for production.
- Planned Stop Time: The stop time that is planned.
- Unplanned Stop Time: The stop time that is not planned (Small stops are not included here).
- Small Stop Time: The time for small stops (The stops that are not long enough to be tracked as stop time).
- Slow Cycle Time: The time that the production cycle took longer than the ideal cycle time.
- Quality Loss Time: The production time used on products that need to be discarded or reworked.
- Produced Good Time: The production time used on products that pass quality check.
- Produced Waste Time: The production time used on products that need to be discarded.
- Produced Rework Time: The production time used on products that need to be reworked.
- Total Count: The production count for good, discarded and reworked products.
- Good Count: The production count for good products.
- Scrap Count: The production count for discarded products.
- Rework Count: The production count for products that need to be reworked.
- Cycle Time: The cycle time for the production in the period.
- Run Time: The time that the production is planned and up and running in the period (Small stops are also included here).
- Planned Production Time: The time that is planned for production.
- Net Run Time: The remaining time after performance loss is subtracted from the Run time (The Run time subtracted with Small Stop Time and Slow Cycle Time).
- Produced Total Time: The production time used for good, discarded and reworked products.
- Full Production Time: The Net Run Time subtracted with Quality Loss Time.
- Availability: The percentages that the production was up and running for the given planned production period.
- Performance: The percentages of the actual production speed compared to the maximum possible production speed for the given planned production period.
- Quality: The percentages of the good production time compared to the total production time for the given planned production period.
- OEE: The product of Availability, Performance and Quality.
- Bar Series: The points that should be shown as bars in the graph.
- Show moving average: It it possible to add a moving average to bar series.
- Add moving average for same period last year: Enable this to compare the trend with last year.
- Period: The period the moving average should be calculated for. The period is always in the same unit as the previously select interval (hour, day, week, etc.).
- Line Series: The points that should be shown as lines in the graph.
- Target reference: Draws a line in graph, if a serie and Target is set.
- Serie: Select a serie from the selected series of OEE-Bar Series, OEE-Line Series, Live - Bar Series or Live - Line Serie,which the line will be drawn for.
- Target: The value, where the line will be drawn on the serie's values axis.
- Include no production: Show the data for the periods, where the period is only in ScheduledLoss.
- Show data values: Show the data in labels.
Example of the Setpoints report:
Example of the Target reference: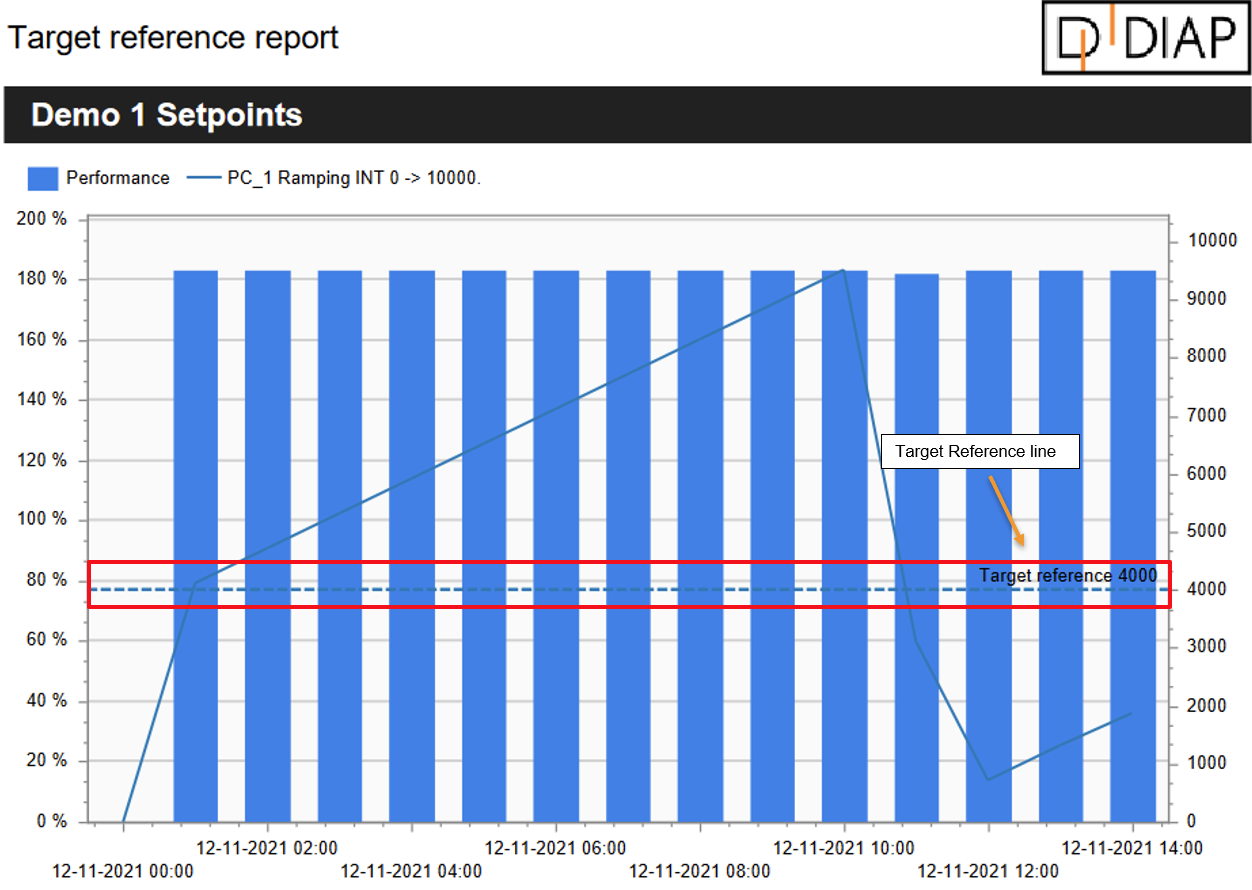
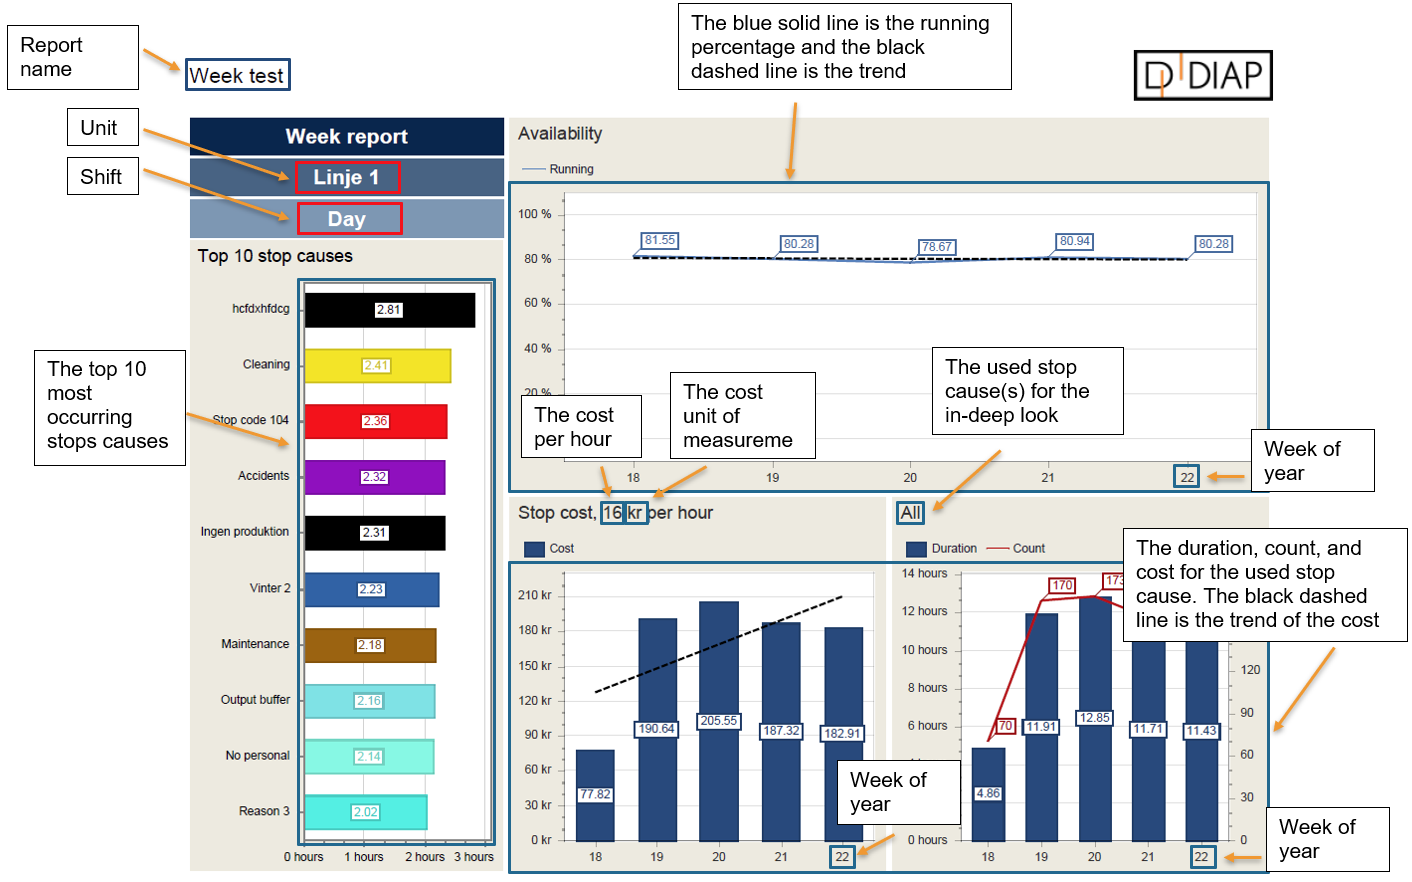
Week:
This report type provides an week by week based analyses of a unit, this includes Availability, top 10 stop causes that happened, in-deep look at a stop cause including duration, count and cost. It has the following parameters:
- Units: The units that should be included.
- Period: The period that should be covered.
- Group data by: Groups the data by Day or Week.
- Shift: The shift type that this report should cover. To cover all shift types, select All here.
- Cost per hour: The cost per hour prize, that the selected stop cause(The one you select in Use stop cause(s)) costs you.
- Cost unit of measurement: The currency you use in Cost per hour.
- Use stop cause(s): The stop cause, you want to measure the duration, count and cost of. You can select All here to use all the stop causes or you can under This select at specific stop cause.
- Show data values: Show the data in labels.
Example of the Week report:
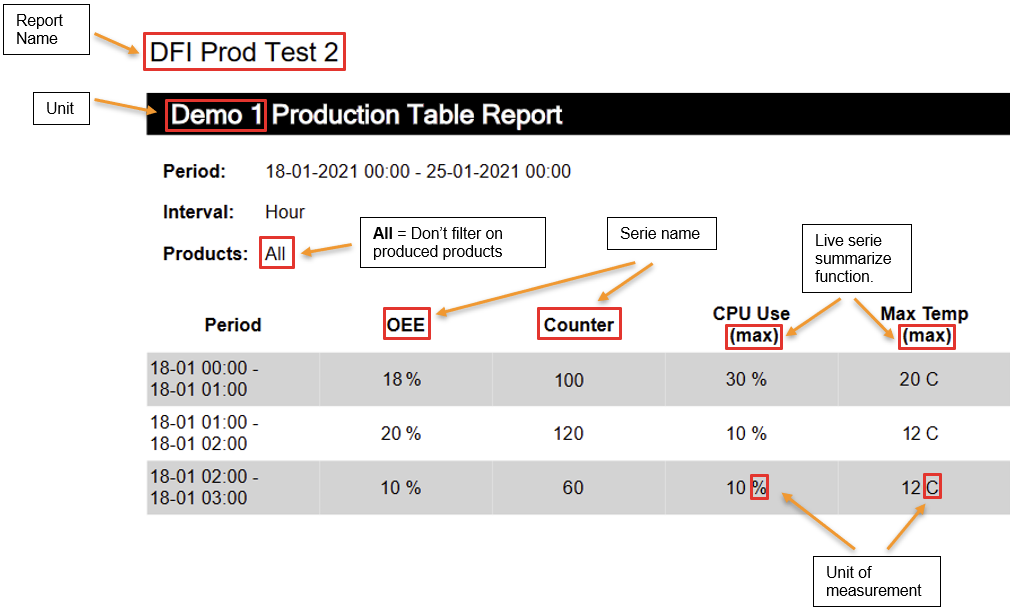
ProductionTable:
This report type provides a table presentation of the OEE and DIAP tag data, where one can summarize the data into periods and see the correlation between your OEE and DIAP tag data. It has the following parameters:- Units: The units that should be included.
- Period: The period that should be covered.
- Interval: The interval, which the period should be split it's data into.
- Product(Optional): Filter the data after the selected products, so when a unit was producing one of the selected products, the data is included. If no products are selected then the data won't be filtered.
- Group By: At the moment it is only possible to group by Order.
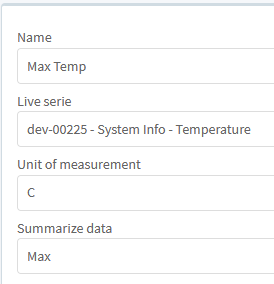
- Series(Max 5): There are 2 serie types OEE and Live. The OEE serie presents OEE numbers and OEE related numbers and the Live serie present the data collected from a DIAP tag.
- OEE serie: Name is the name of the series, OEE serie is the OEE data in the serie and Unit of measurement is an option for you to add a unit of
measurement to the numbers.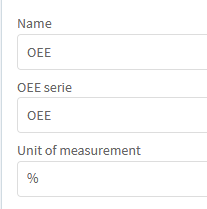
- Live serie: Name is the name of the series, Live serie is the DIAP tag data in the serie, Unit of measurement is an option for you to add a unit of measurement to the numbers. Summarize data is the function used to summarize the data for the period, the options are Sum, Average, Min, Max and Difference between min and max.
- OEE serie: Name is the name of the series, OEE serie is the OEE data in the serie and Unit of measurement is an option for you to add a unit of
Example of the ProductionTable:
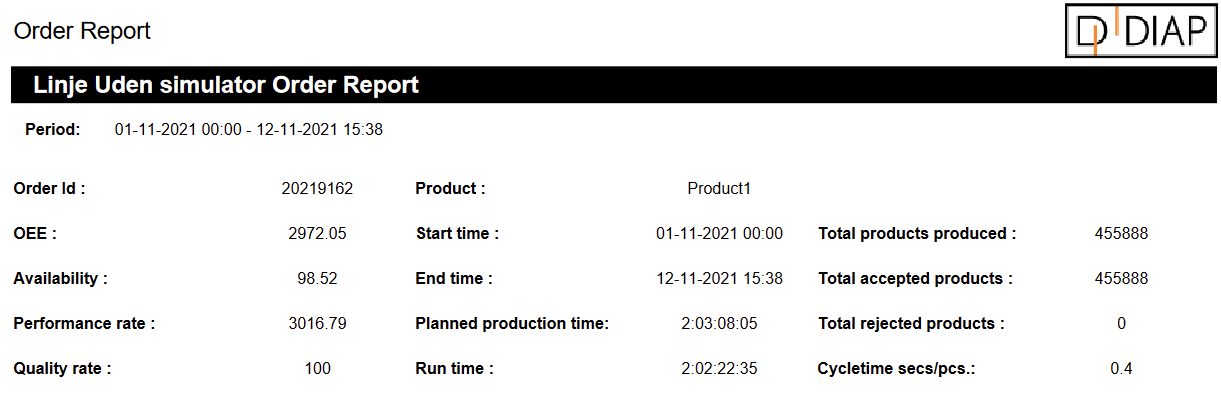
Order:
This report type provides an detail overview of the OEE for the orders, this includes the OEE numbers, availability numbers and the production numbers. It has the following parameters:
- Units: The units that should be included.
- Period: The period that should be covered.
Example of the ProductionTable:
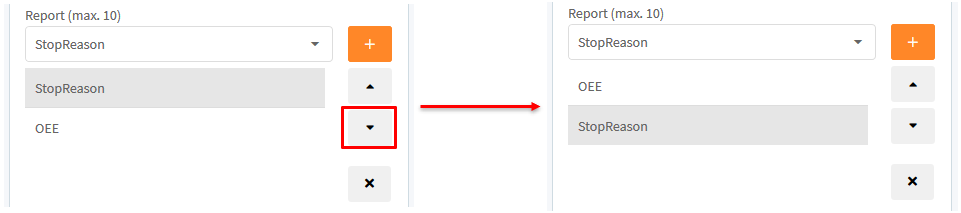
Report type ordering
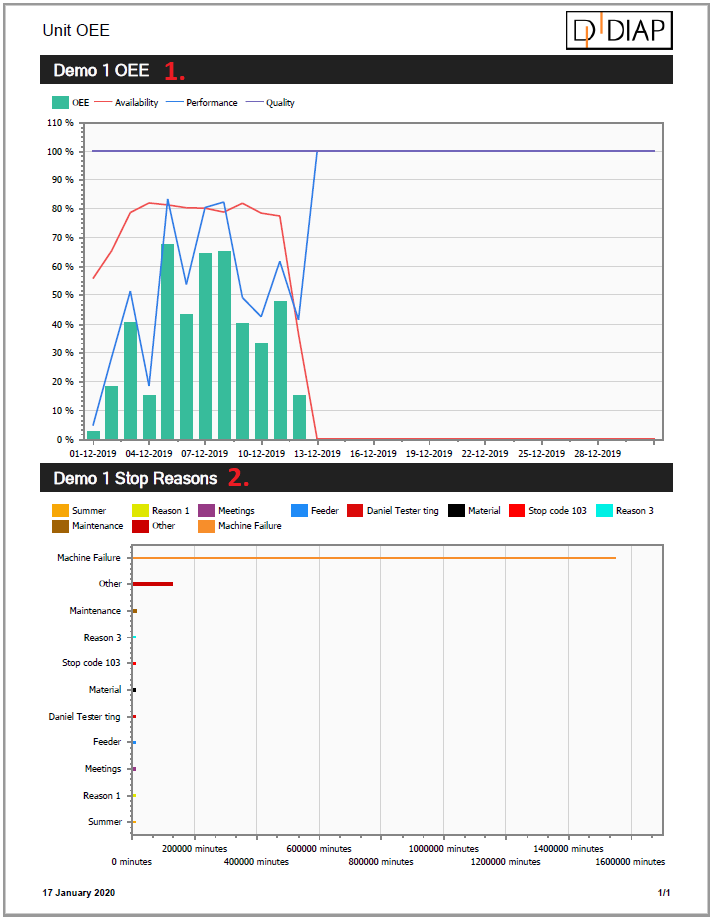
The order that the report types are placed in the list:
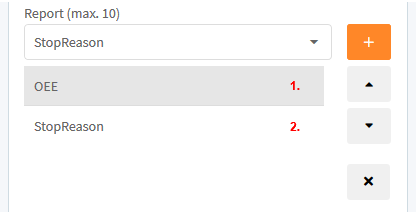
Will also be the order, that they are represent in the mailed report:
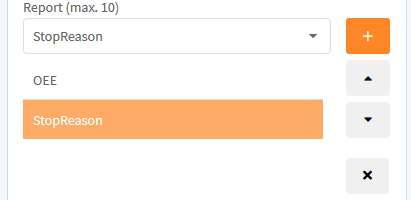
If you want a report type to be higher on the list, select it:
And click the "up" button.
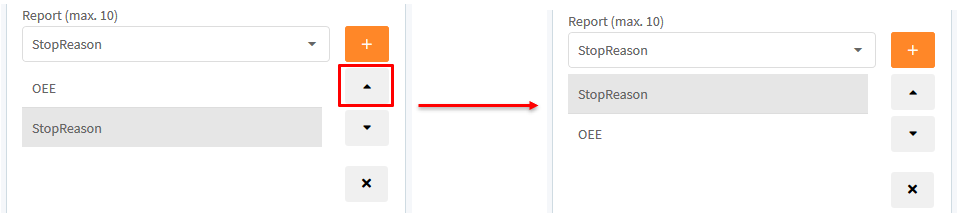
And for lowering the order, click the "down" button.
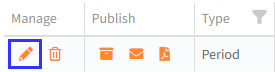
Edit a subscription
Click the "edit" button for the subscription you wish to edit.
Note:
If you alter a co-user's subscription, then you become the new creator of the subscription.
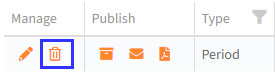
Delete a subscription
Click the "Delete" button for the subscription you wish to delete.
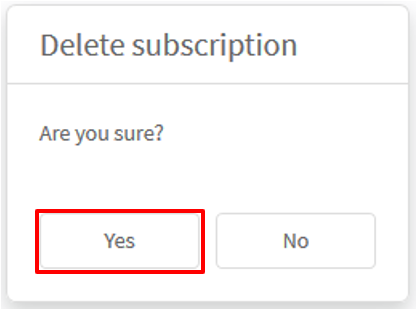
Click "Yes" to confirm your decision.
Archive
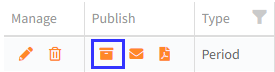
You can access all the reports that have been mailed in the archive.
Click the "Archive" button for a subscription.
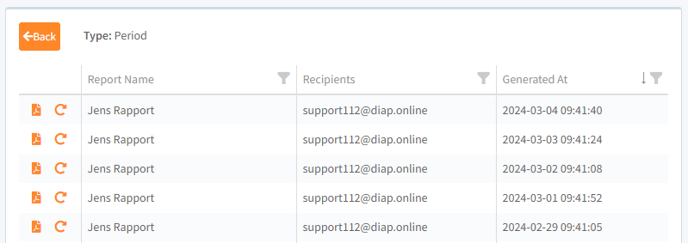
The following information is presented in a subscription:
- Report Name: The name of the report.
- Recipients: The users the report is mailed to.
- Generated At: The date and time that the report was generated.
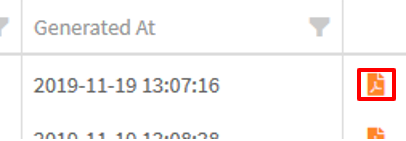
Get report in archive
Click the "PDF" button of a report to download a copy of it.
Recalculate reports in subscription archive
It is possible to recalculate archived reports by clicking on the "Recalculate" button.
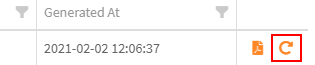
This will recalculate the report using the current configuration for the subscription. This way you can see the data with a different configuration than the original one.
The report isn't downloaded. To do that, you have to click the PDF icon left of the "Recalculate" button.
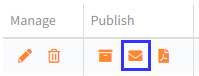
Manually send mail.
You can send the report manually and not wait for the date and time shown in "Next Send".
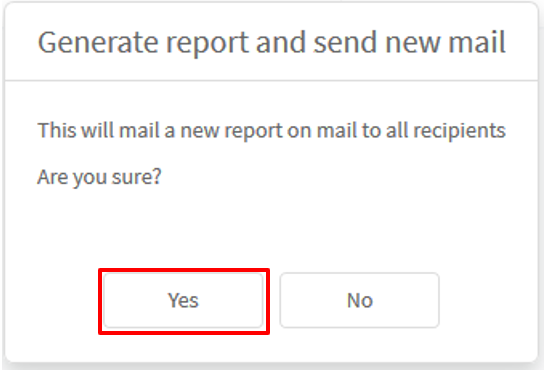
Click the "mail" button to send a mail with the report.
Click "Yes" to confirm your decision.
Note:
If you send a mail manually, only the current available data will be included in the report. If you want all the data covering the selected period for the report types included, then you have to wait til the mail has been sent by the system.
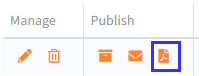
Get current report.
You can get the current report for a subscription and not wait for it to be sent and archived.
Click the "PDF" button to get current report.
Note:
If you get a report this way, only the current available data will be included in the report. If you want all the data covering the selected period for the report types included, then you have to wait til the report has been archived.