Introduction
- This guide describes how to use the Production speed site. This site is used to view production speed information for several unit simultaneously.
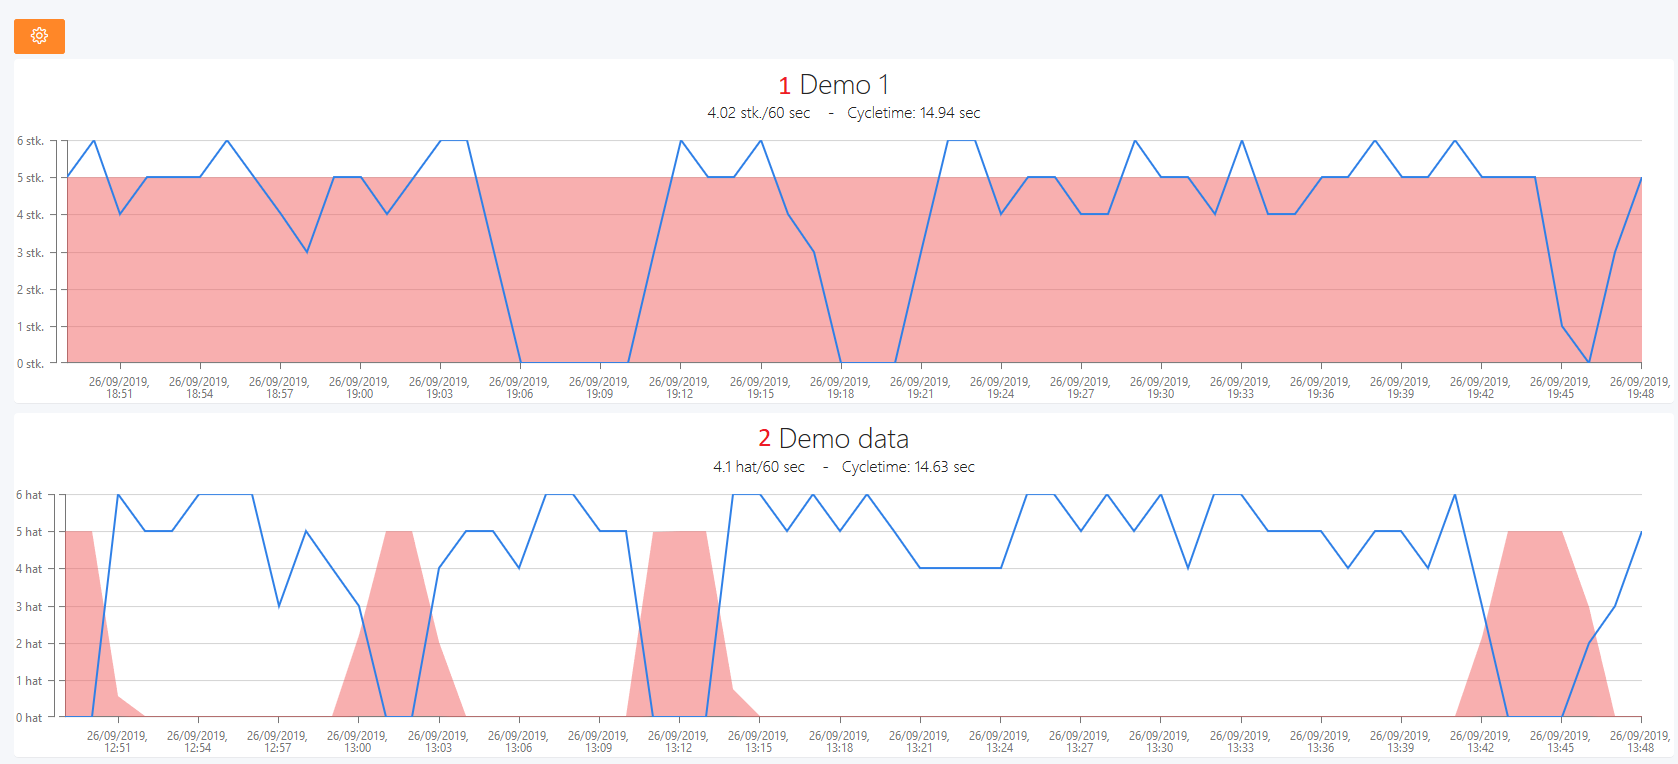
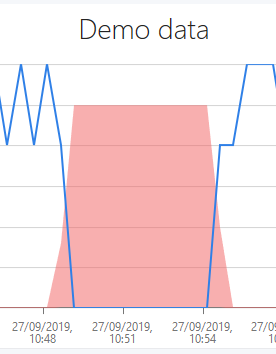
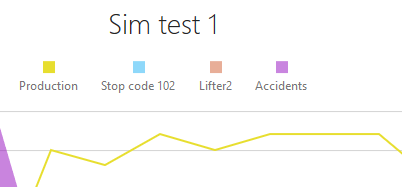
The Production speed site shows graphs over different units.
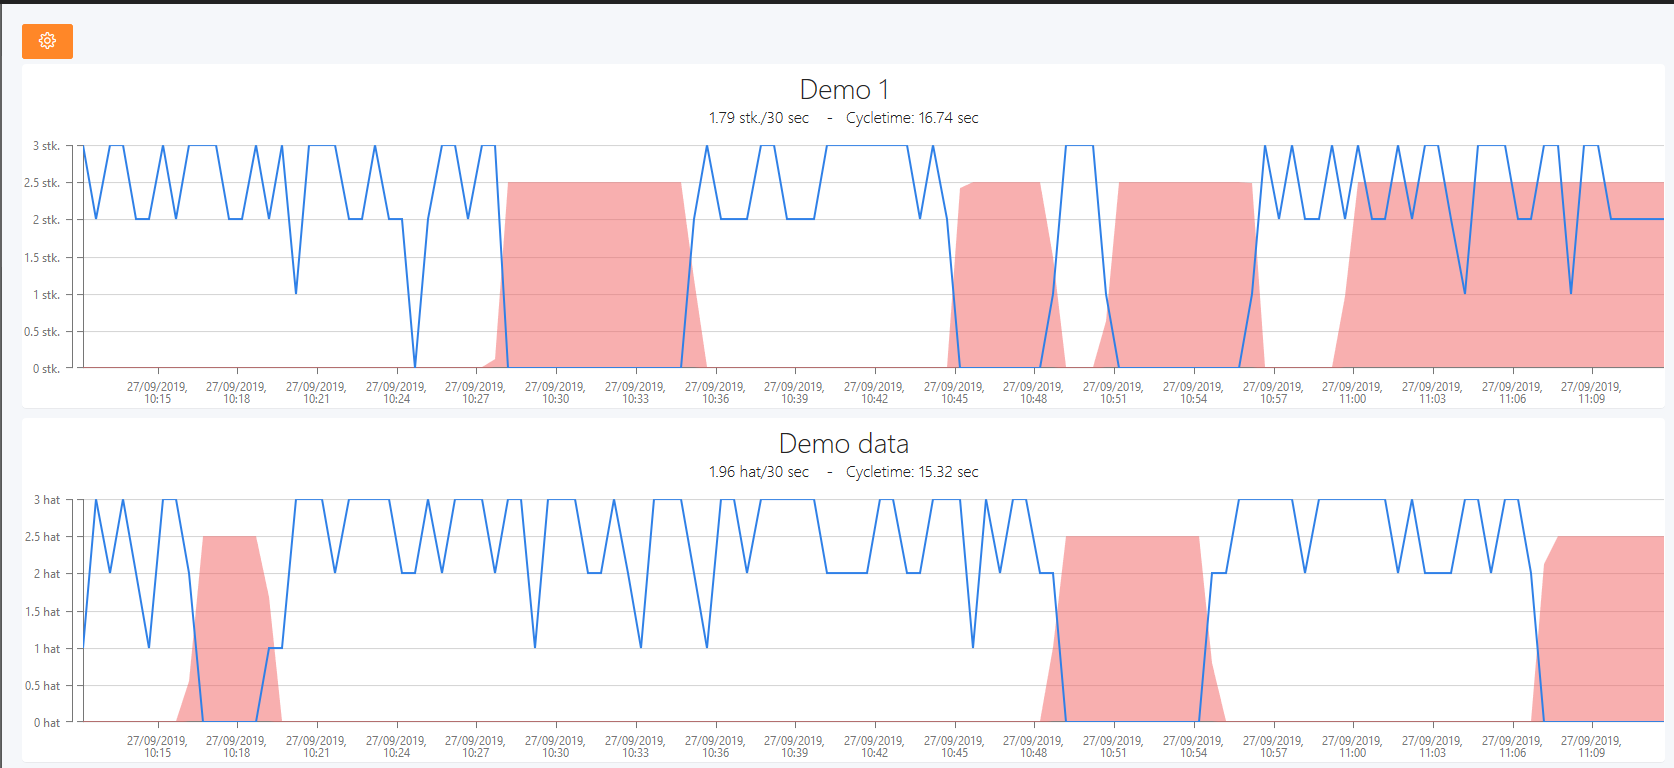
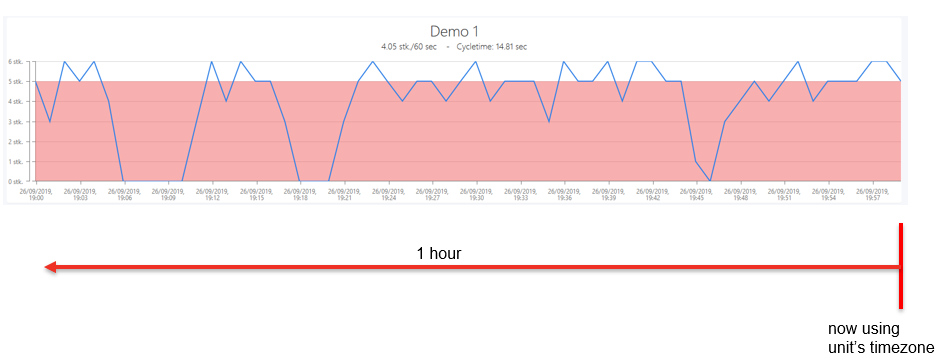
The blue lines represent the produced items and the red area represents how much a unit was stopped and not producing.
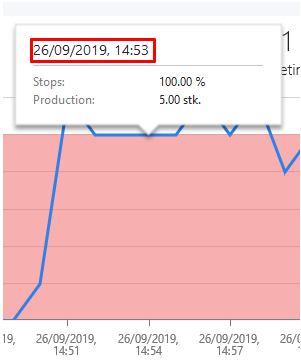
You can hover the cursor over a graph to get details over the individual periods that the graph covers.
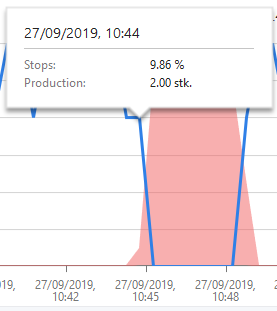
Here is shown, that the unit was stopped 9.86 % of the period and produced 2 stk. See the Interval section of this guide for details about the date time range that the period covers.
Setup
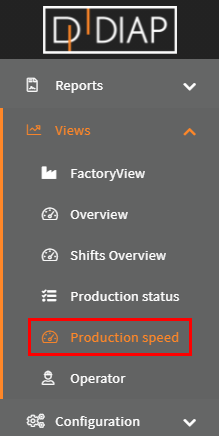
Go to the "Production speed" menu.
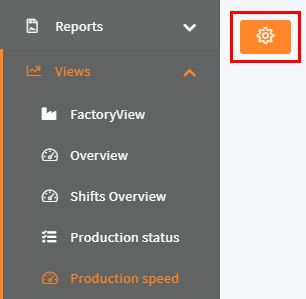
Click the "Configure button".
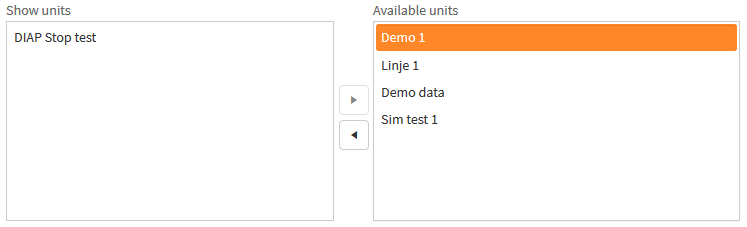
Select unit to view
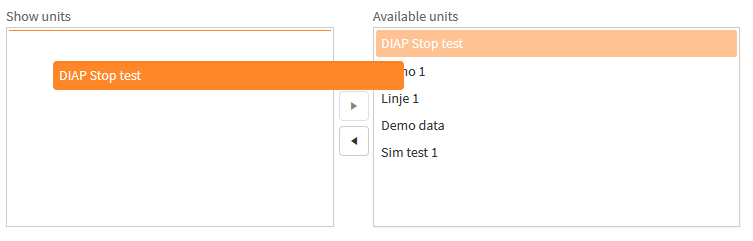
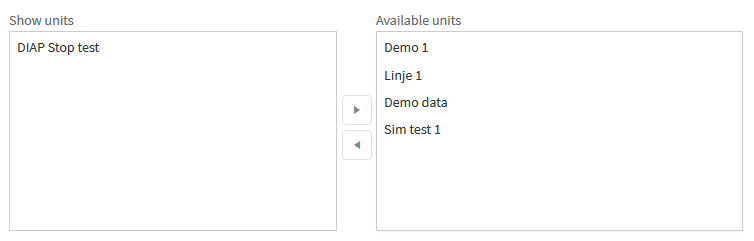
Drag and drop the units from the Available units list to the Show units list. These are the units that you wish to see the production information for.
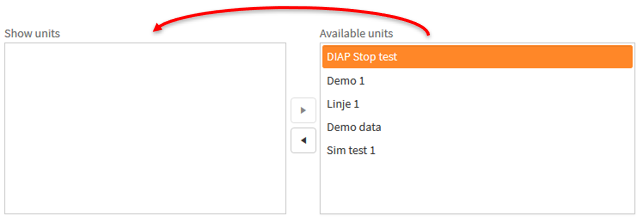
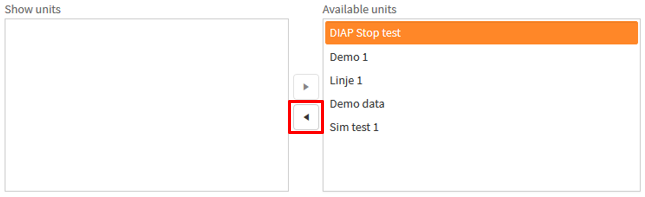
Arrow button method
You can also use the arrow button instead of the drag and drop method. Select a unit in the Available units list.
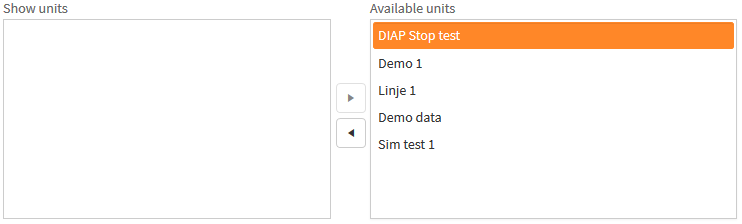
Then, select the arrow button pointing left.
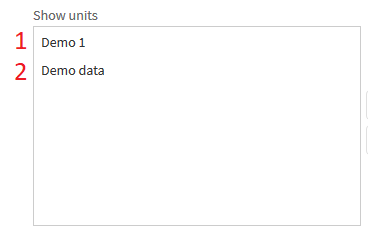
Order of the graphs
The order in which the units are listed in the Show unit list corresponds to the order that the graphs are shown in the Production speed site.
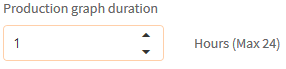
Production graph duration
The Production graph duration sets the time duration, which the graphs should show. This begins at the current time (using the unit's configured timezone) and goes backwards. You can max set the graphs over a span of 24 hours.
You can view the configured timezone for a unit in the units site.

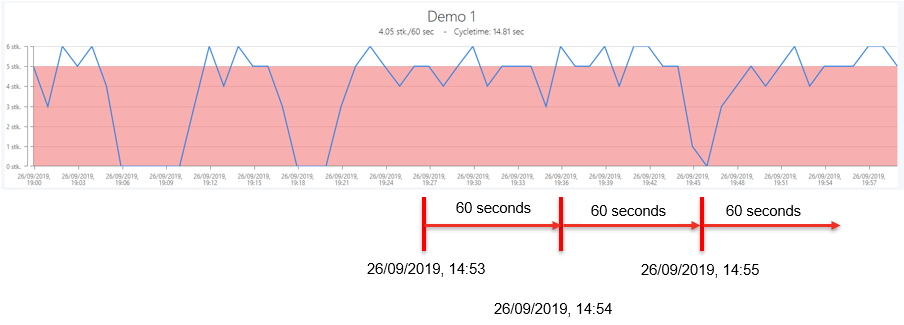
Interval
Interval sets how many seconds an interval should span.
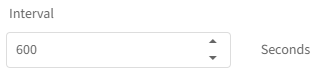
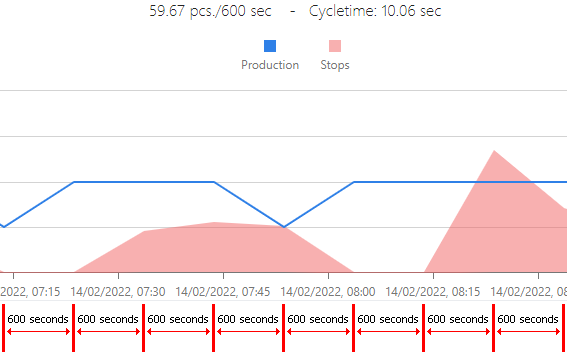
The stops and production shown in the tooltip, when one hovers the cursor over a graph, covers the period from the shown timestamp to timestamp + interval.
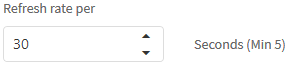
Refresh rate per
The Refresh rate per set includes how many seconds that pass before the graphs are updated. The fastest refresh rate is 5 seconds.
Show average production speed and cycle time
The Show average production speed and cycle time set shows if the average production speed and cycle time should be shown or not.

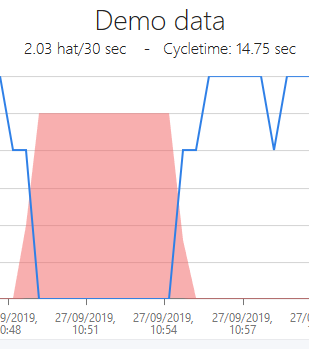
Average production speed
The average production speed is the average production over a period spanning the interval.
1.98 stk. /30 sec means that the average production is 1.98 stk. over a period of 30 seconds.
The stk. is the default unit of measurement. This is configured for a unit in the units site.

Cycle time
The cycle time is the average cycle time over the period spanning the production graph duration.
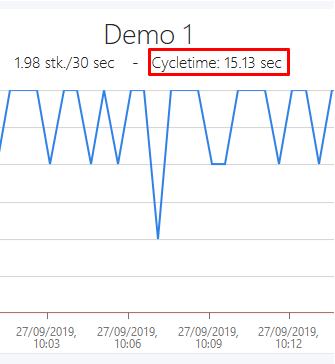
Cycle time: 15.13 sec means that the average cycle time is 15.13 seconds over a period of the production graph duration (1 hour was used here).
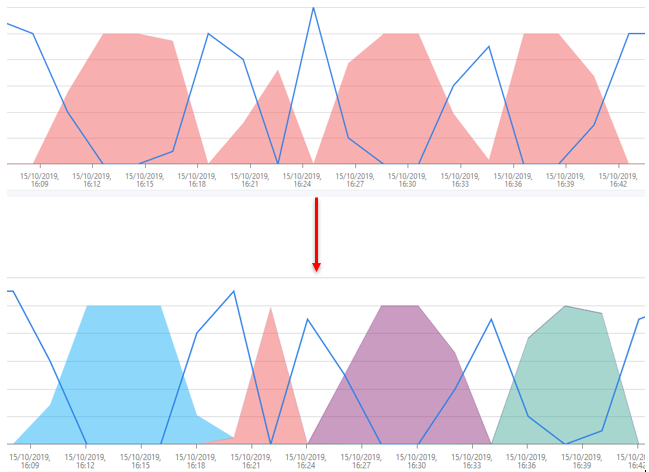
Show individual stops
The Show individual stops, splits the stops into the individual stop types, if set.

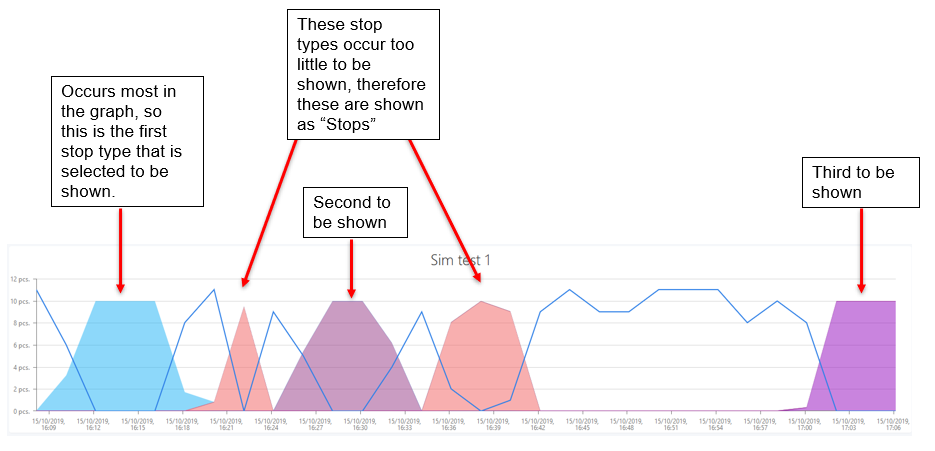
How many of most occurring stop types should be shown
The How many of most occurring stop types should be shown sets the maximum number of different stop types that should be shown in the graph. The stop types that occur most are the ones that are first selected to be shown, while the rest of the stop types that occur are summed into the "stops" category.

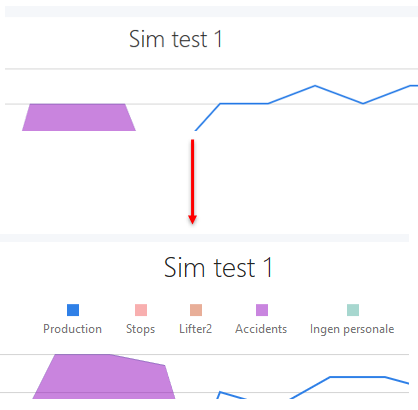
Show legends
The Show legends shows the legends in the graph, if set.

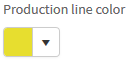
Production line color
The Production line color sets the color of the production line in the graph.
To change the color, click the color picker and select your color.
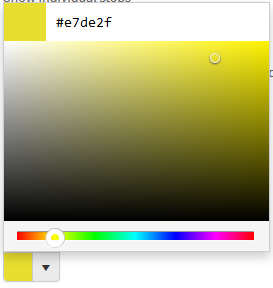
When you have selected your color, click somewhere else in the settings popup to close the color picker.