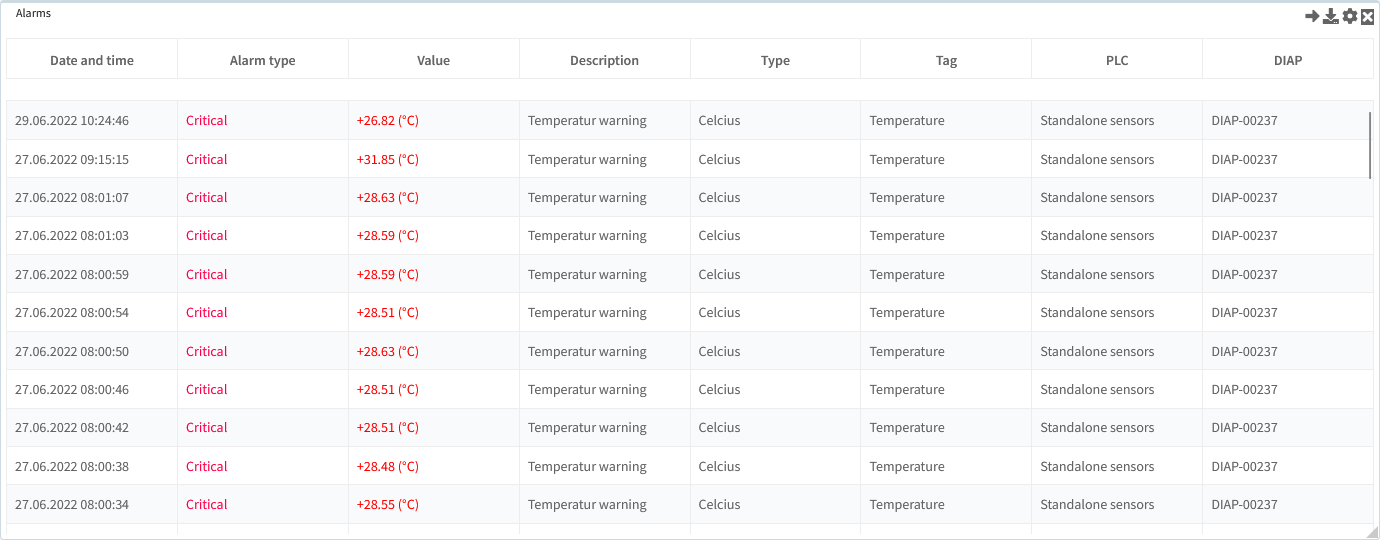
How to create an Alarm (widget: Alarms)?
Requirements
In order to show an alarm in a dashboard, you must first set up the alarm under "Alarms" in the main menu.
Guide
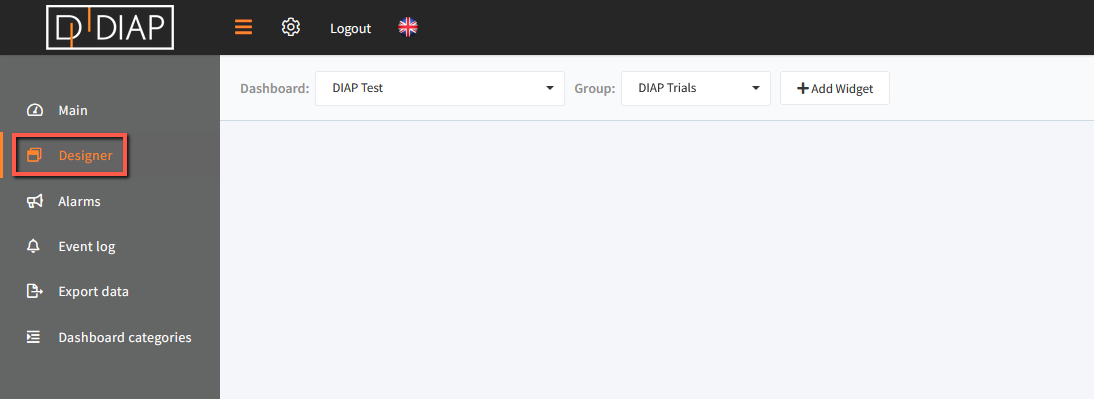
Go to the Real-time application and select Designer in the main menu.
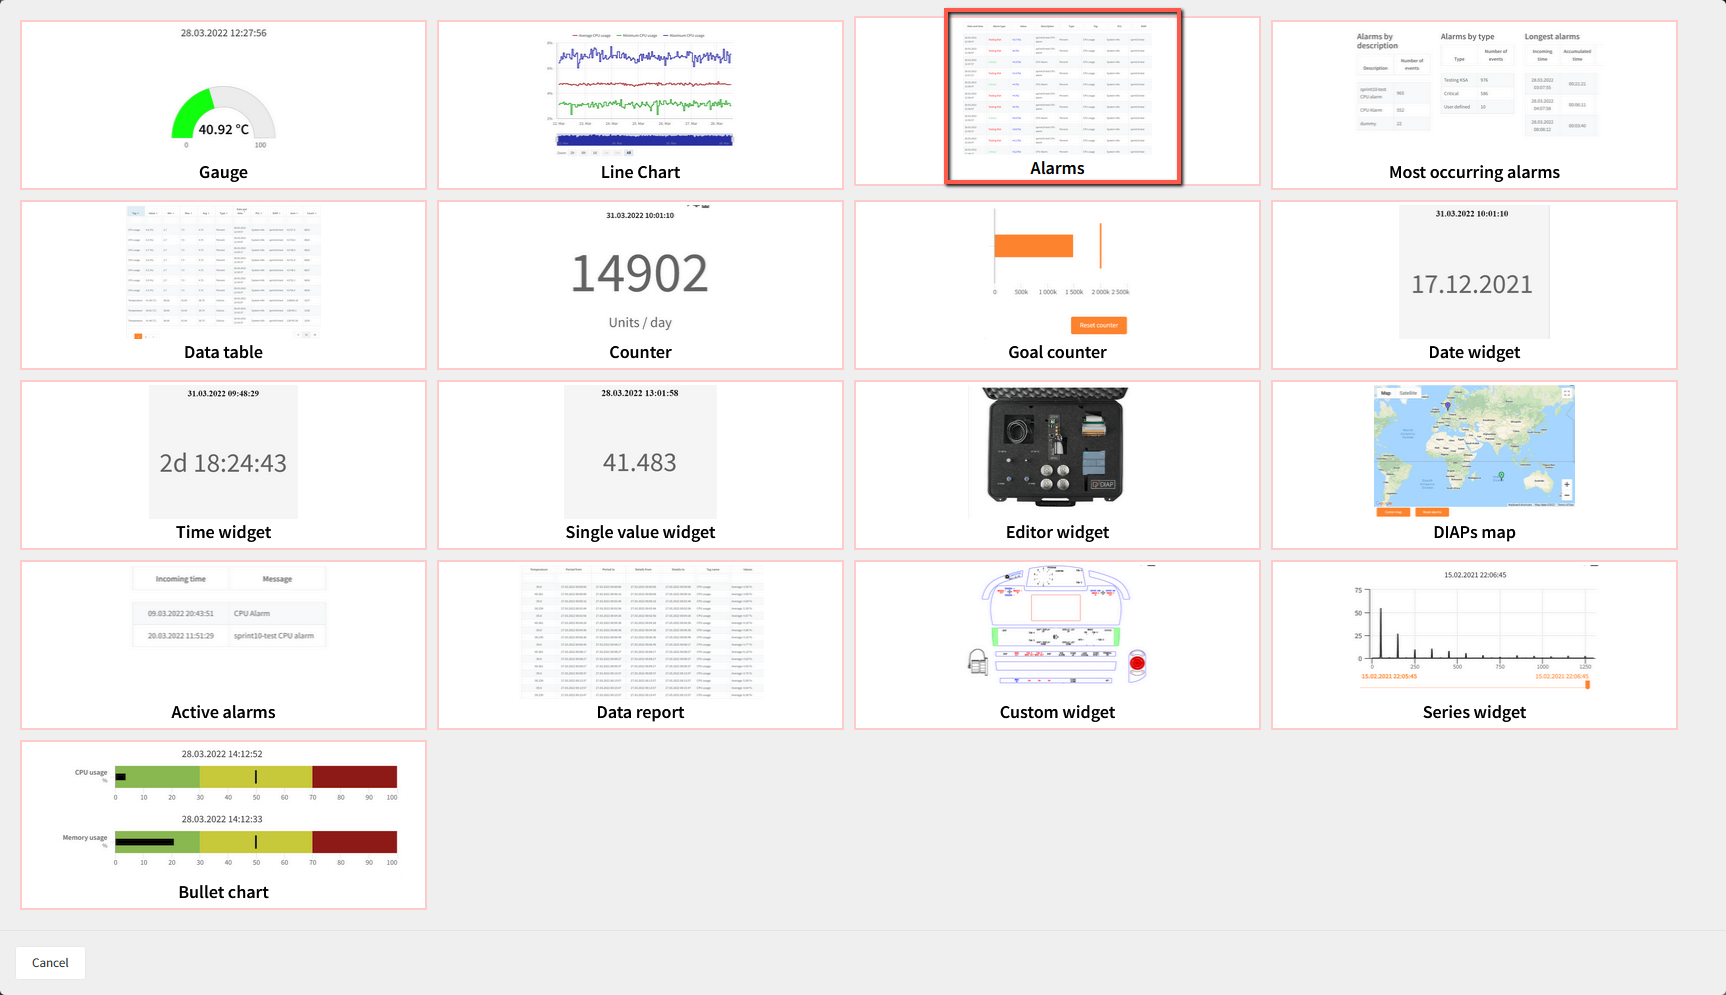
Click "+ Add Widget" and a popup window will open.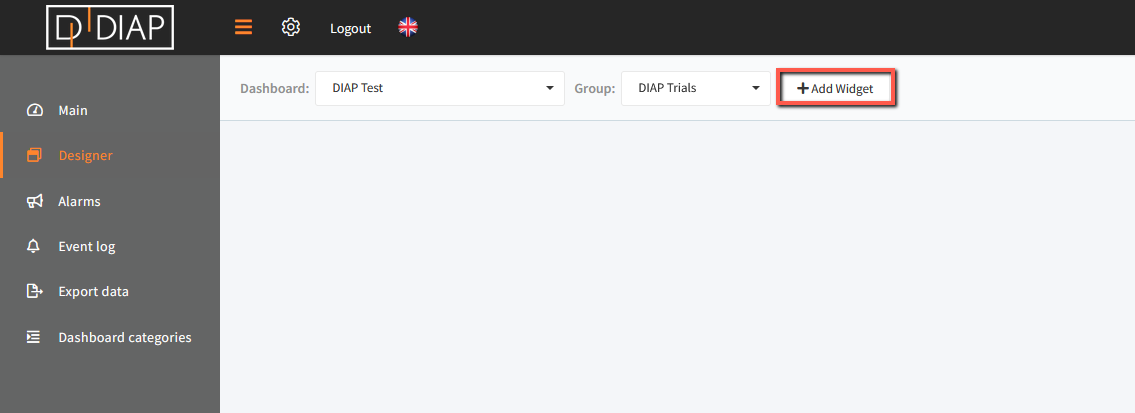 In the popup window you have to choose "Alarms"
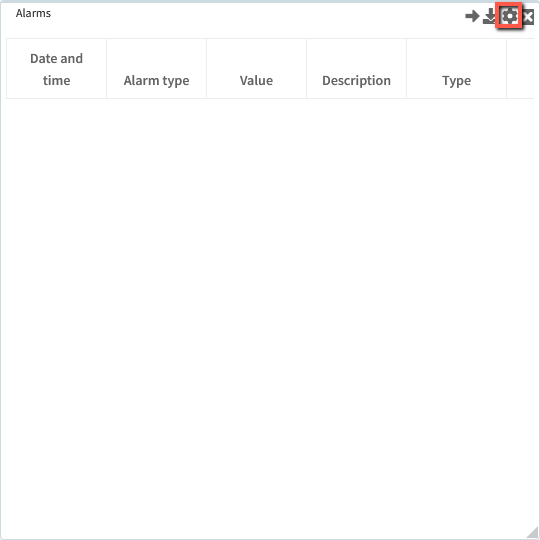
The alarm widget will be shown in the dashboard. Click the cogwheel to set the alarms to be displayed.
A pop-up will appear. Fill in the required information.
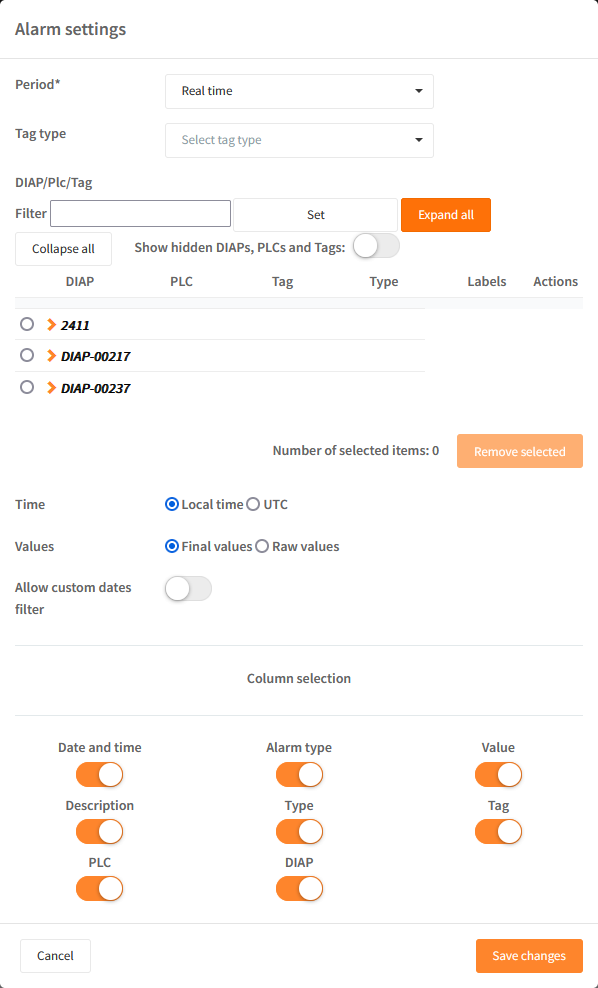
Field explanation:
- Period: Select the period of data you wish to display within the alarm widget.
- Tag type: Choose if you wish to see all alarms from tags/sensors with this exact tag type.
- Selection of data - expand the DIAP and select tag:
- DIAP: Select the DIAP that you wish to show data from.
- PLC: Choose PLC or sensor.
- Tag: Select the tag that you would like to visualize data from.
In the example below, we have chosen to see CPU alarms from a specific DIAP.
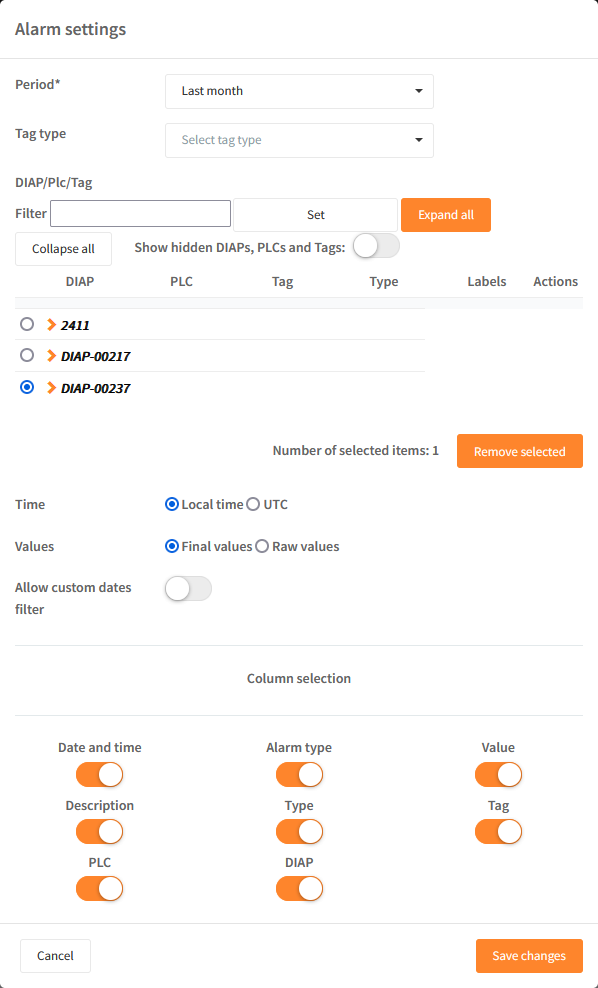
Remember to "Save changes" when finished.
