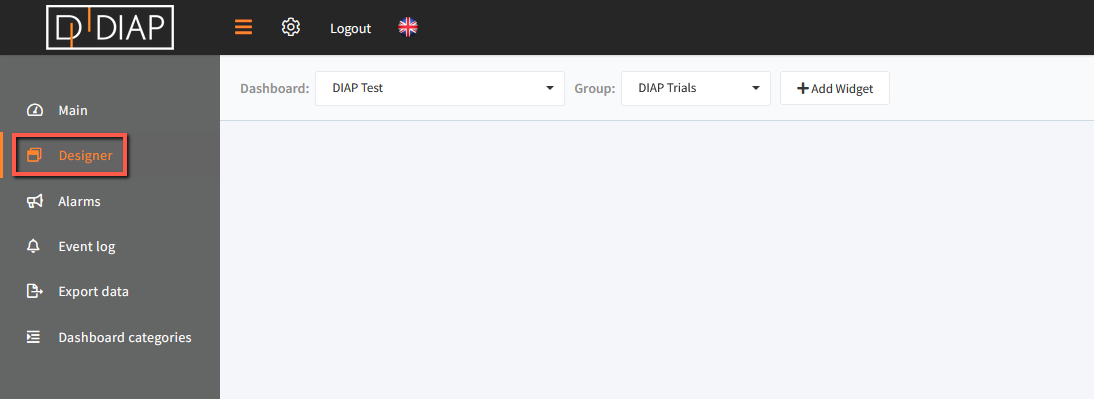
Go to the Real-time application and select Designer in the main menu.
Click "+ Add Widget" and a popup window will open.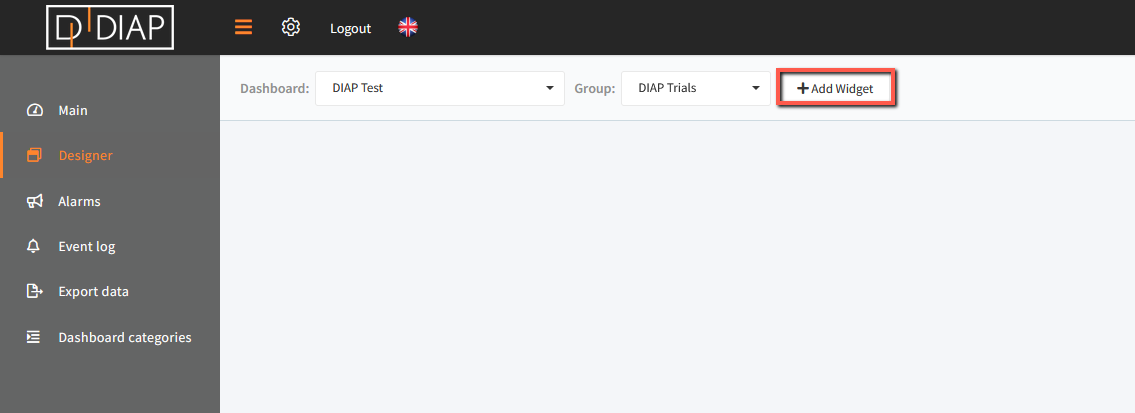 In the popup window you have to choose "Gauge"
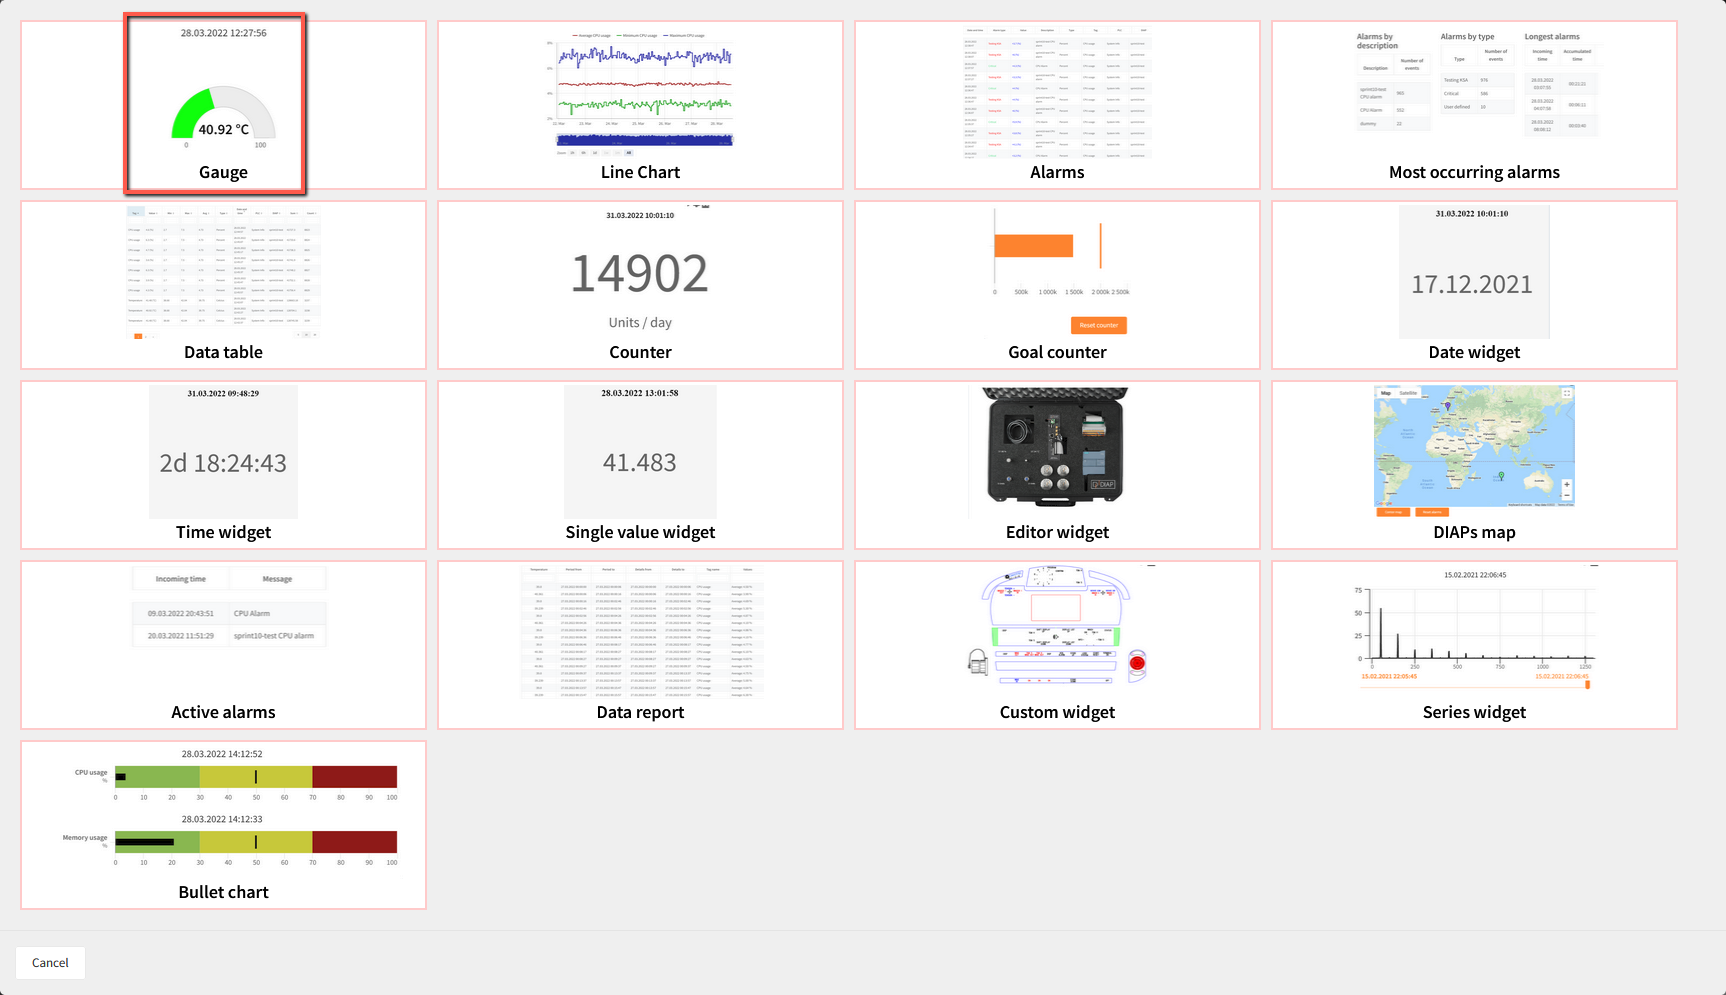
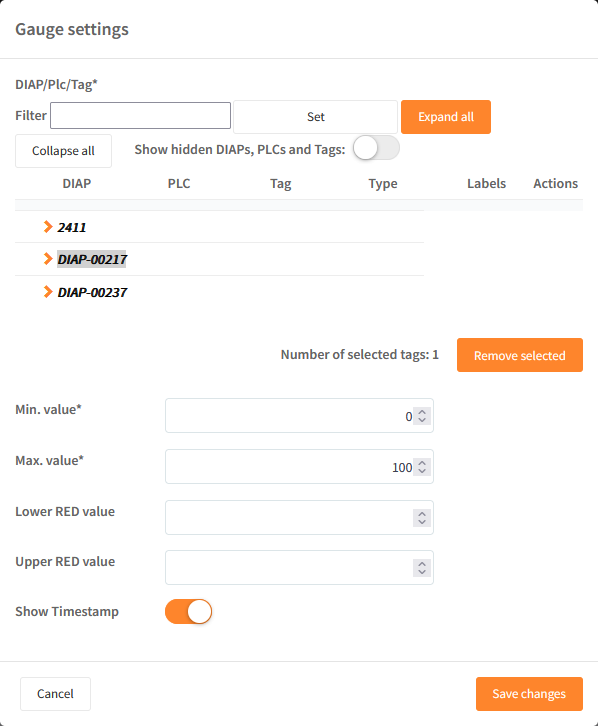
You will now see a pop-up where you need to define the data that you wish the gauge to display.
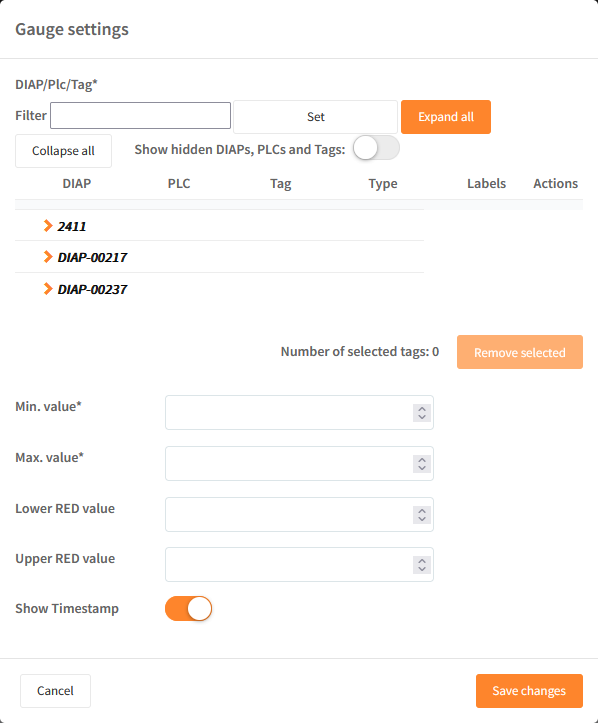
Field explanation:
- Selection of data - expand the DIAP and select tag:
- DIAP: Select the DIAP that you wish to show data from.
- PLC: Choose PLC or sensor.
- Tag: Select the tag that you would like to visualize data from.
- Min. value: Defines the minimum value of the gauge.
- Max. value: Defines the maximum value of the Gauge.
- Lower RED value: When the value comes near the lower red value entered here, the gauge will turn red (the field can be empty).
- Upper RED value: When the value comes near the upper red value entered here, the gauge will turn red (field can be empty).
- Show Timestamp: When activated, a timestamp from the last successful reading of the tag/sensor will be displayed.
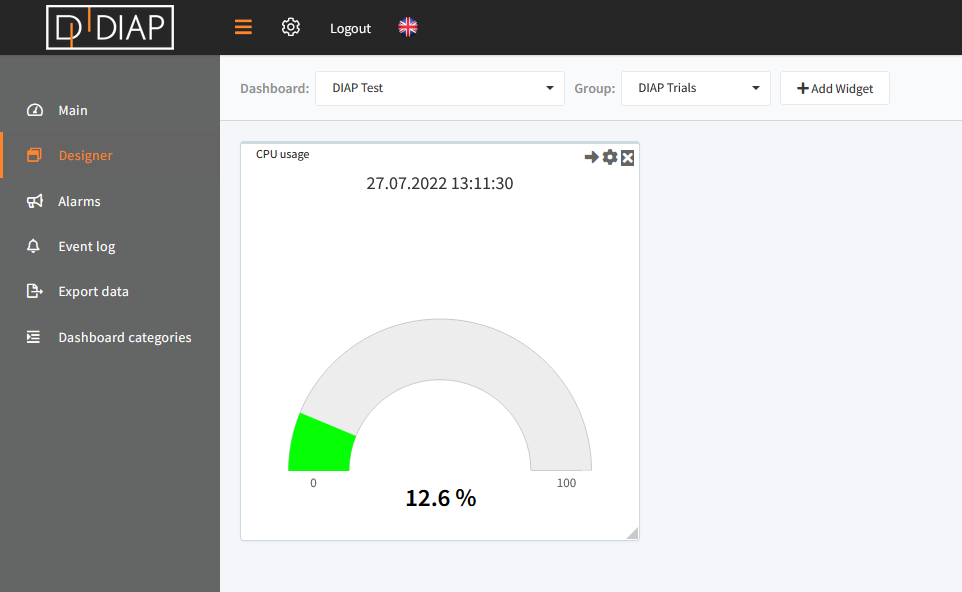
See example below:
In the example below, the gauge will display the CPU usage of the DIAP.
You can use this widget to visualize any given value.
Remember to Save changes when done.
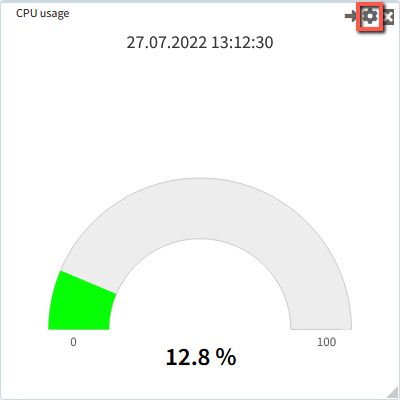
How to edit a gauge
Click the cogwheel to edit the gauge.
You will now be able to edit all values.
In the example below, we have changed the "Lower RED value" to 5.
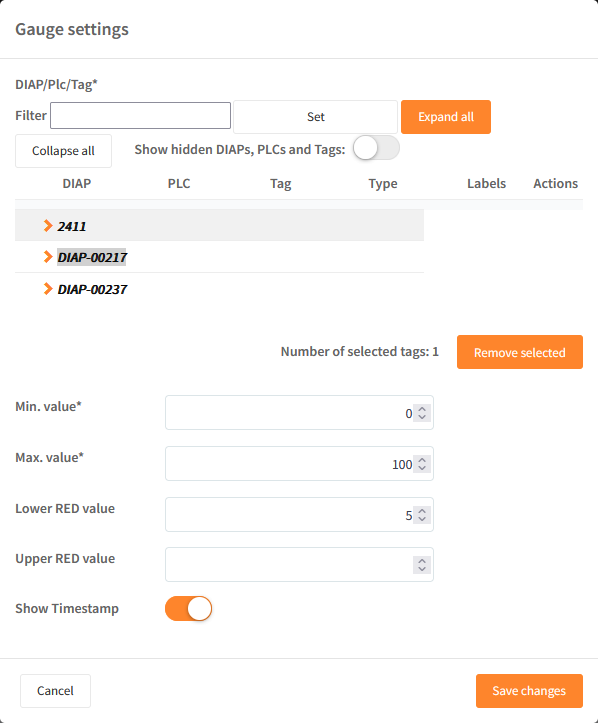
Click "Save changes".
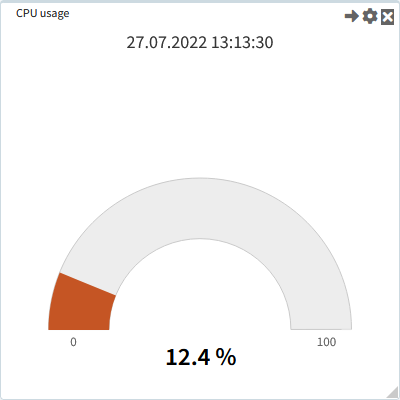
The CPU has moved above 5% and is consequently red.