Guide
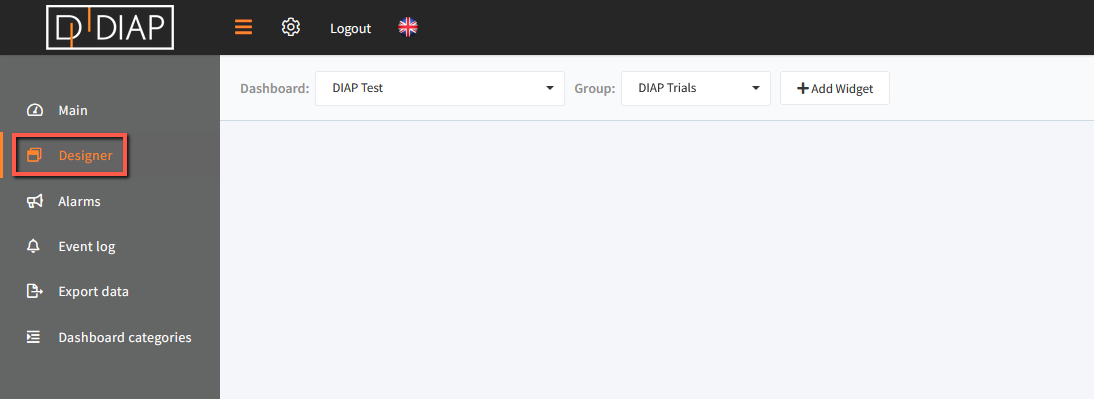
Go to the Real-time application and select Designer in the main menu.
Click "+ Add Widget" and a popup window will open.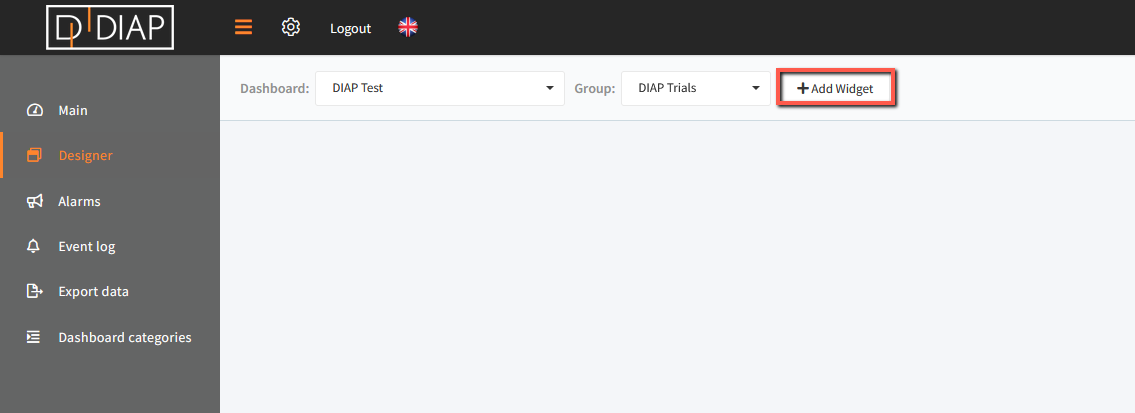 In the popup window you have to choose "Data table"
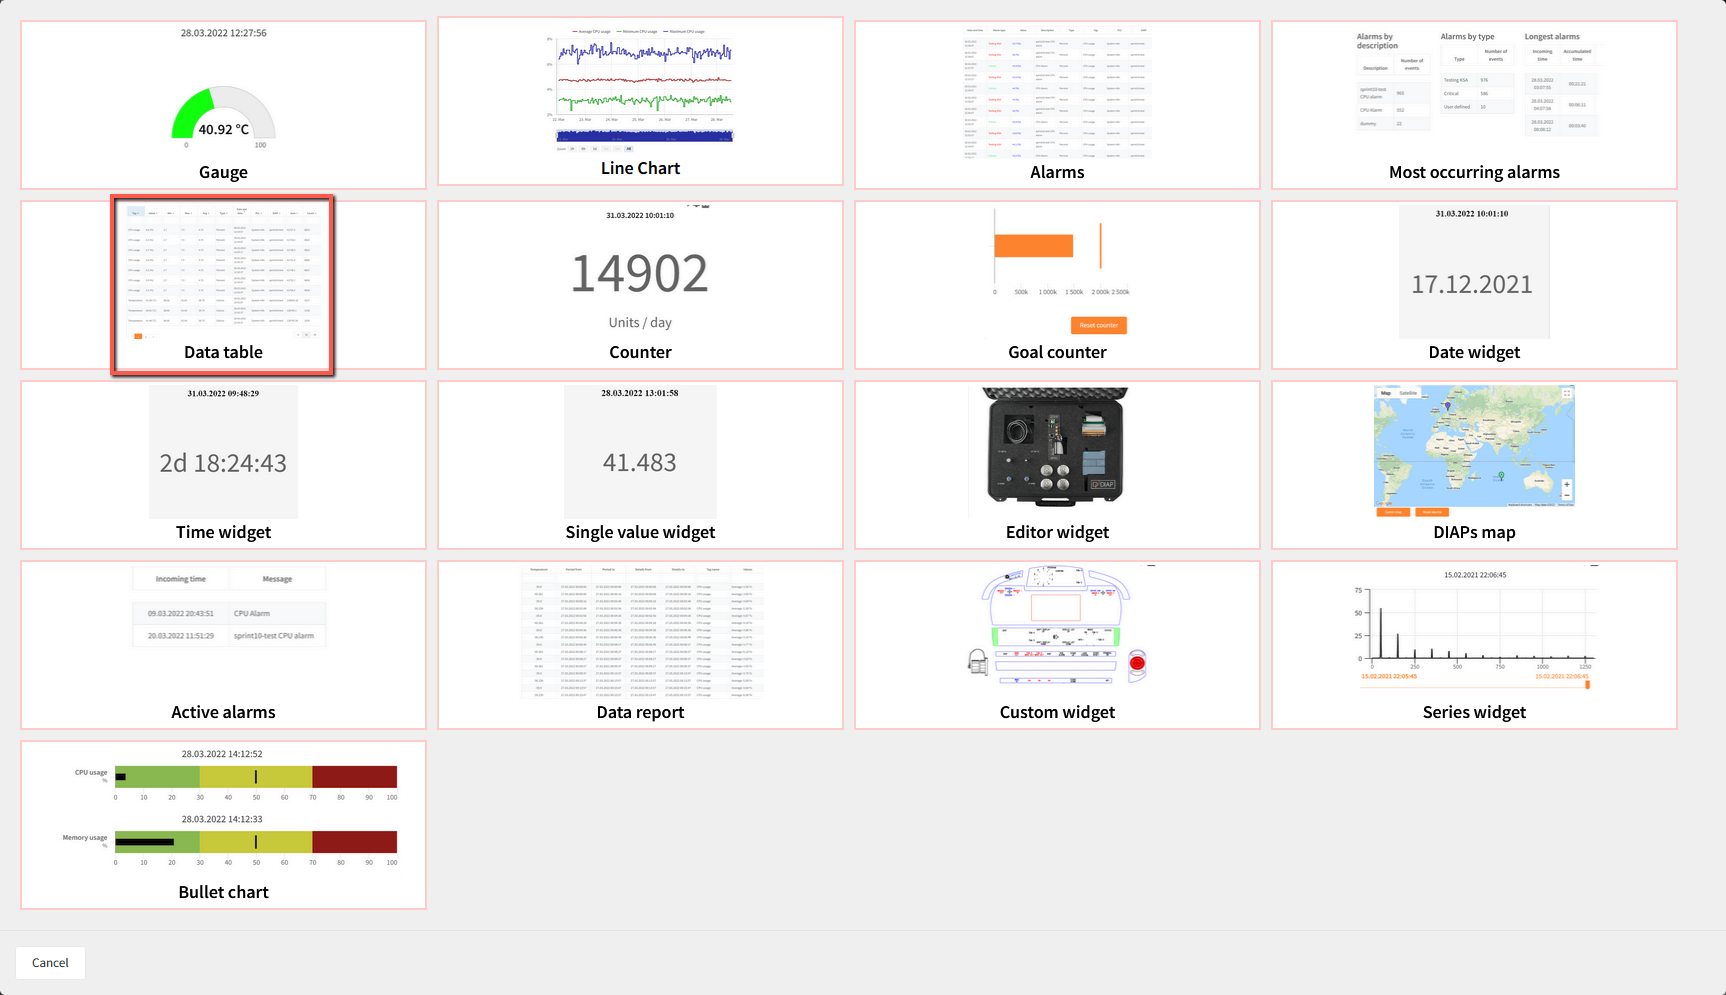
You will now see a pop-up where you need to define the data that you wish the data table to display.
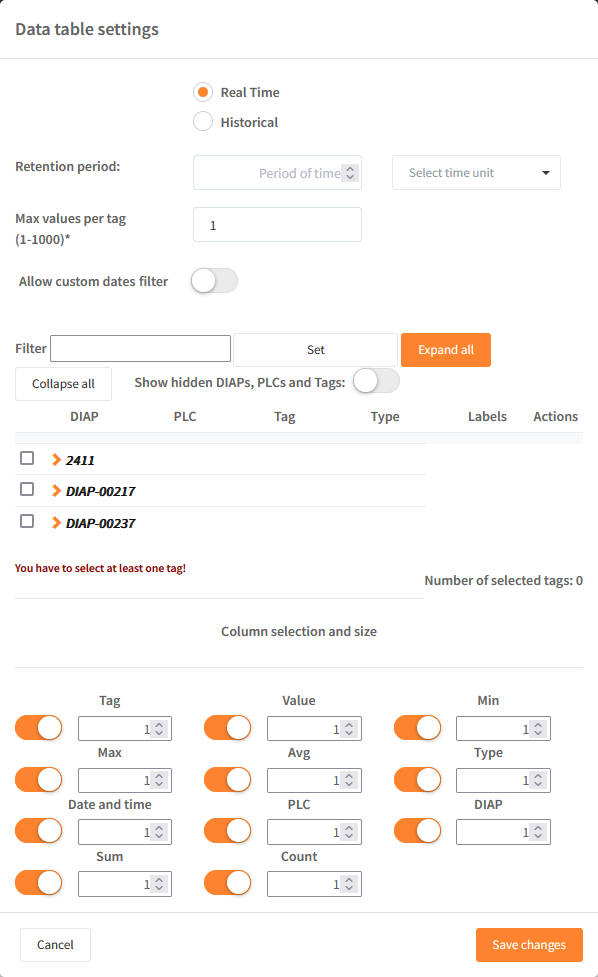
Field explanation:
- Real Time / Historical:
- If you select Real Time, you will see information from the current time and x amount of time back in time.
- If you select Historical, you will see historical data from a from and to time and date.
- Retention period: This field be active if you select Real Time above. Enter the period of time that you wish to see data from - e.g. 30 minutes back in time. If you select Historical above, you will be able to choose a specific period (from/to date and time).
- Max values per tag: Here, you can define the number of readings that you wish to see of the same tag during the time period selected above.
- Allow custom dates filter: Enabling this will make it possible for the operators to set a custom data on the page "Main".
Data has to be selected to be added to be displayed in the graph. You can display multiple values in the same graph. Data selection can be found in the lower part of the popup window.
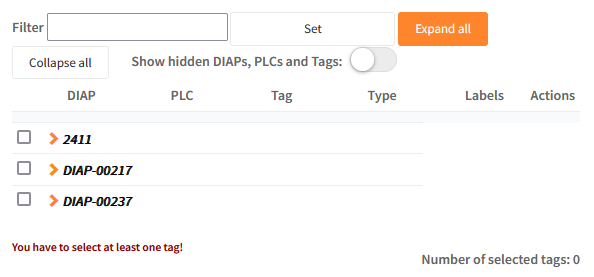
Field explanation
- Selection of data - expand the DIAP and select tag:
- DIAP: Select the DIAP that you wish to show data from.
- PLC: Choose PLC or sensor.
- Tag: Select the tag that you would like to visualize data from.
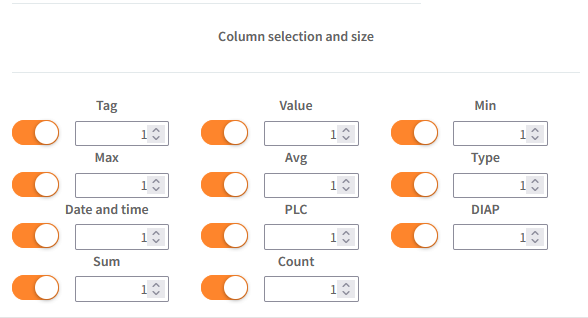
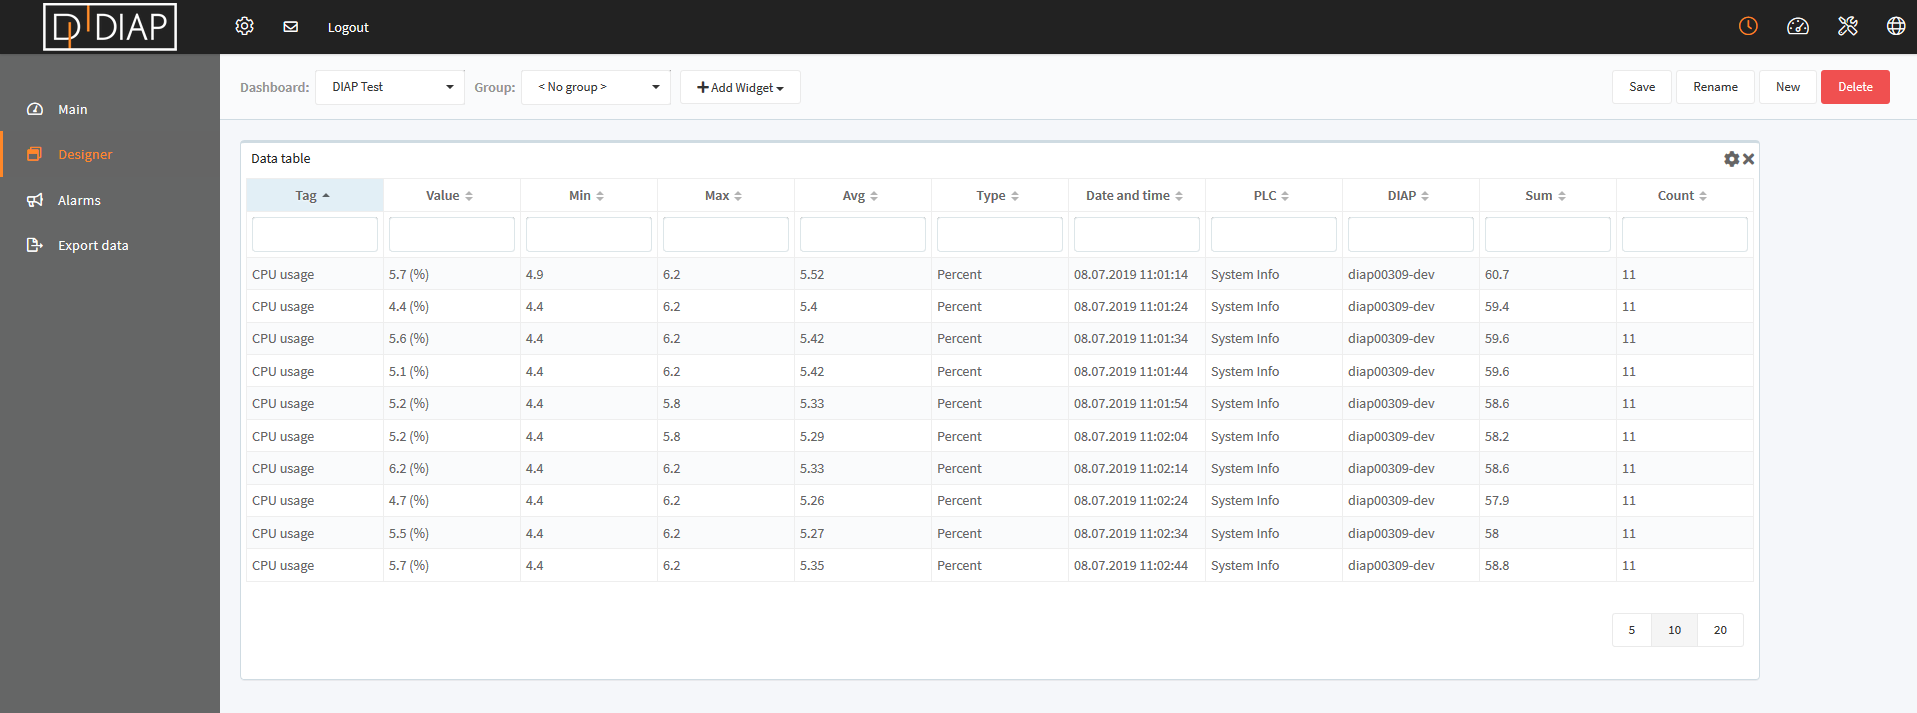
The values shown above can be toggled on/off for the data table. You can change these settings at a later point in time.
Additionally then it is possible to determine the size of each of the field in relation with each other.
Remember to click "Save changes" to save the current data table.
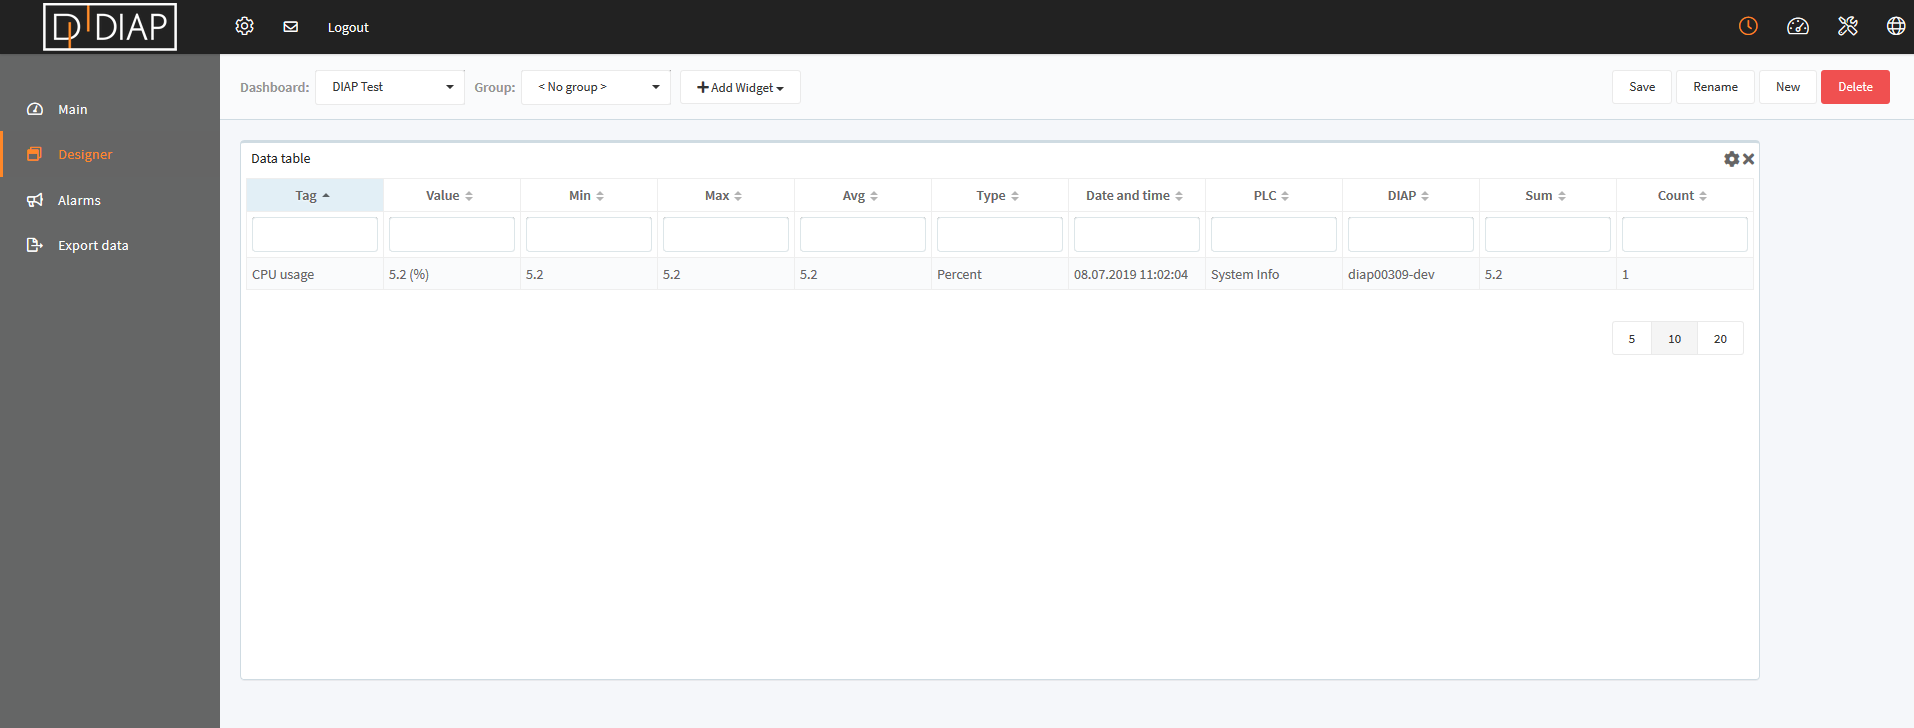
In the below example, "Max values per tag" has been set to 10.