It is possible to add a comment to a graph, by using the widget "Line Chart".
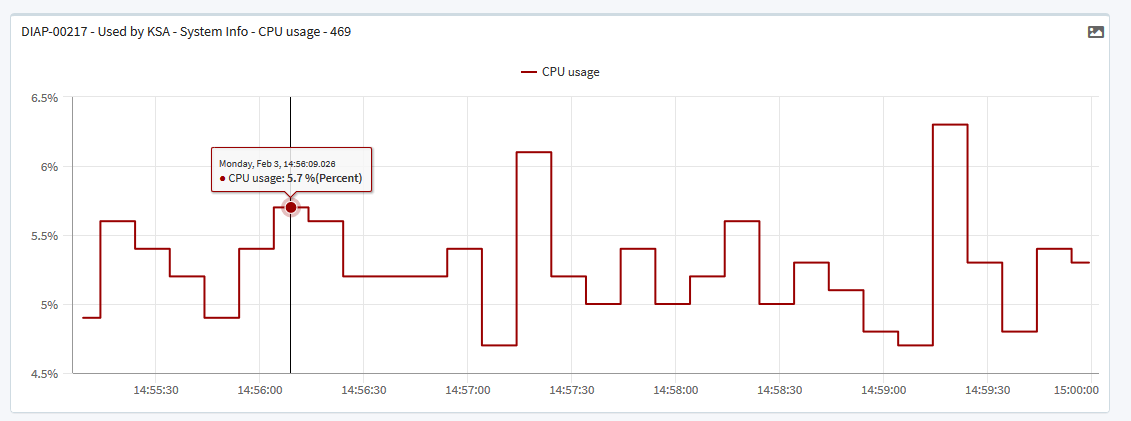
Hold "Ctrl" and press "left mouse click" at the point where you wish to add a comment - as seen in the graph below.
Thereafter, the following pop-up will open.
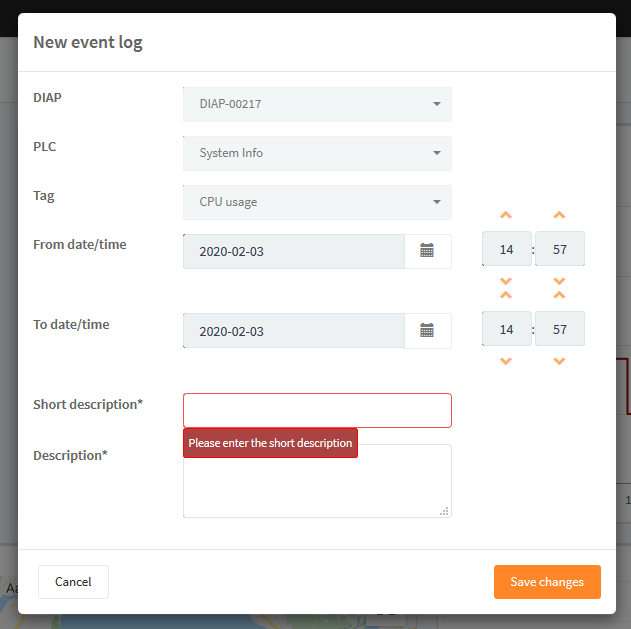
Most of the fields will be static (cannot be changed).
"Short description" and "description" can be used for inputting information. Short description will be shown in the graph.
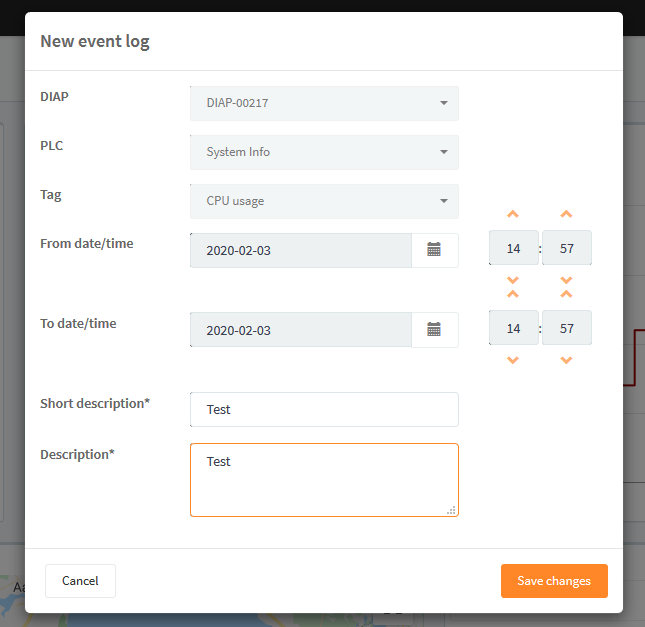
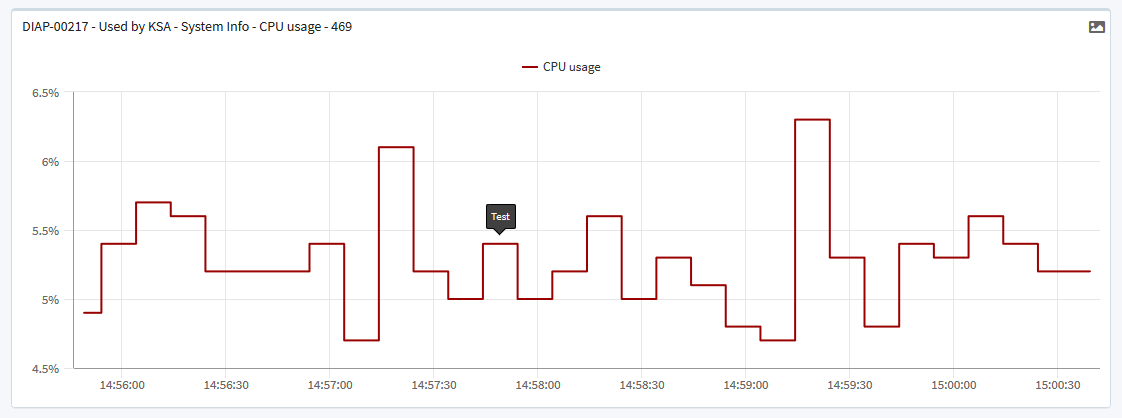
Press "Save changes". Afterwards, the window will close and the graph will show the comment.
The comment will also be shown in historical graphs, if the date and time for the comment are included.
If you wish to see all comments, then go to "Event log" in the navigation.
There, you will see an overview of all the comments that have been put into the graphs.
Different filters can be used to find the correct comment.
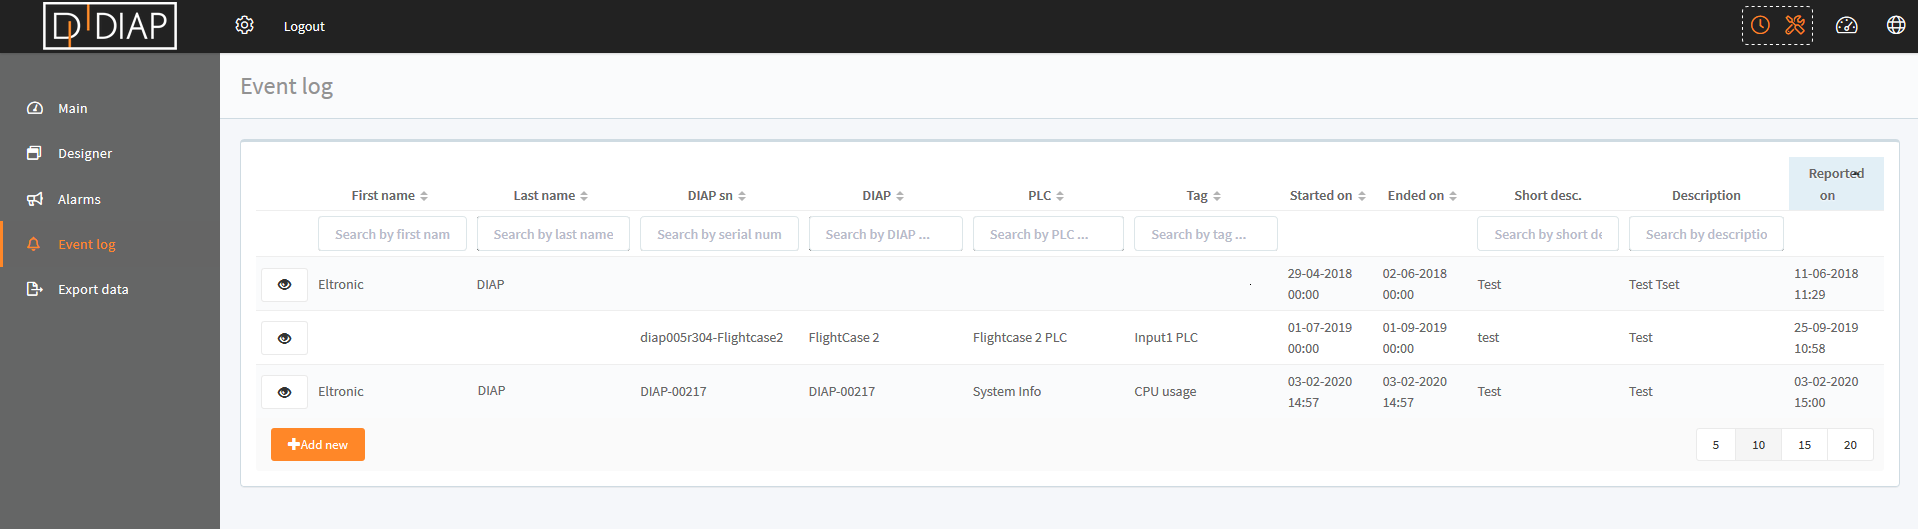
Press the  "eye" to view more information about the comment.
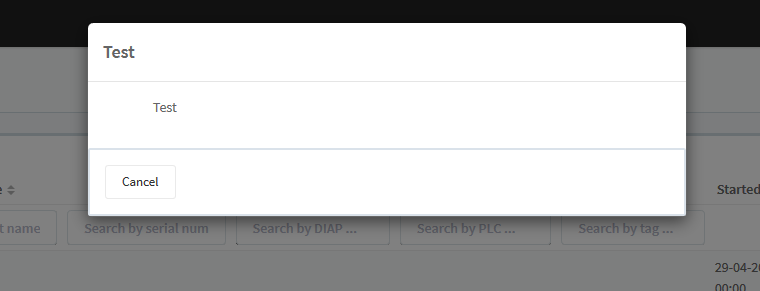
Press "Cancel" to close the window once again.