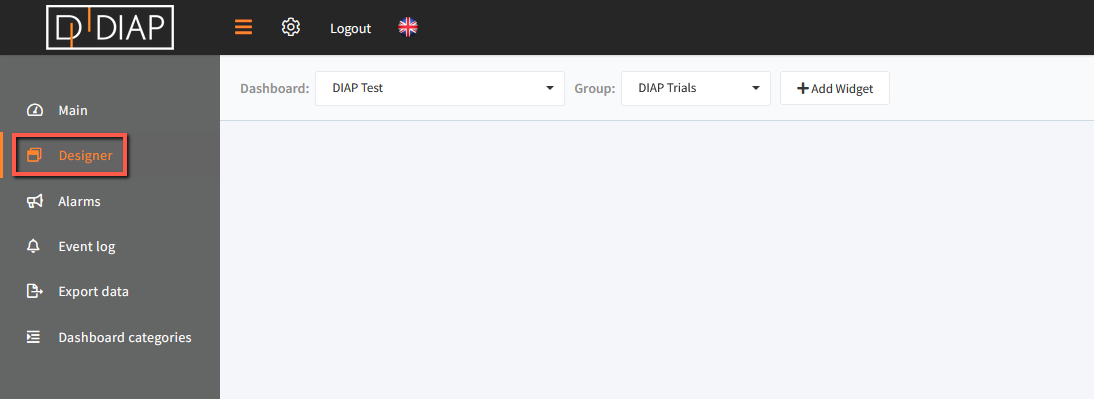
Go to the Real-time application and select Designer in the main menu.
 Click "+ Add Widget" and a popup window will open.
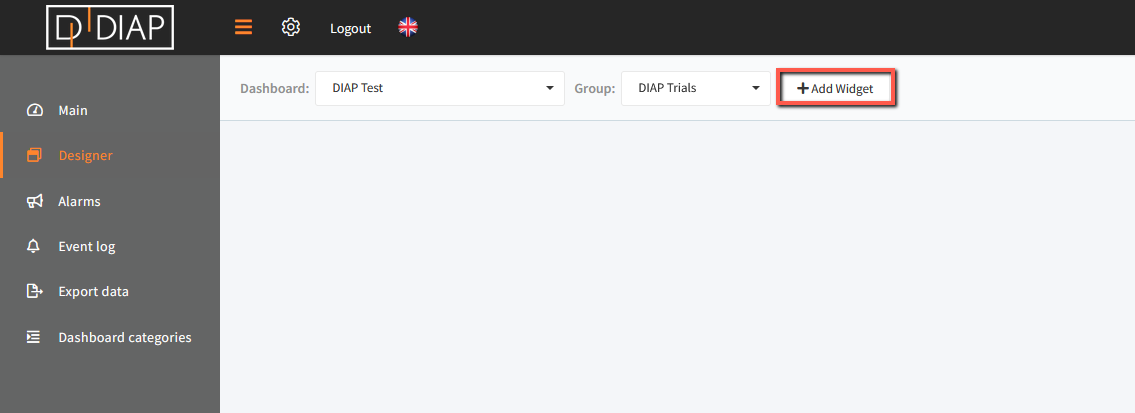 In the popup window you have to choose "Single value widget"
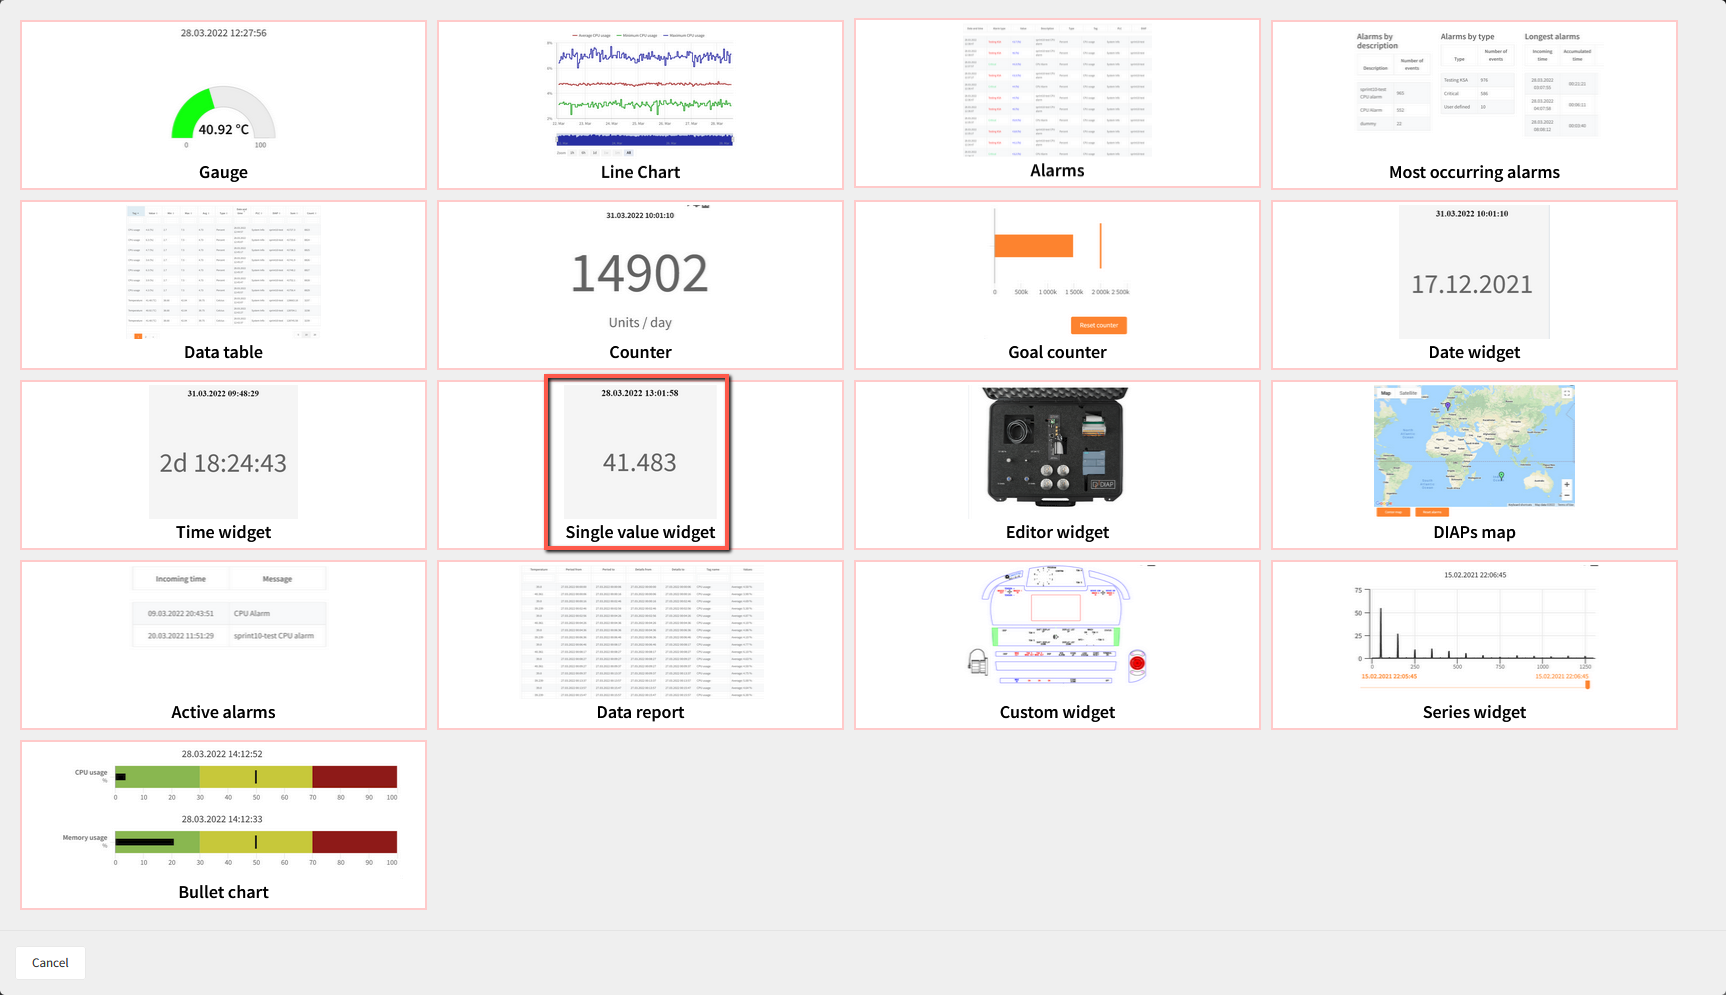
You will now see a pop-up where you need to define the data that you wish the single value widget to display.
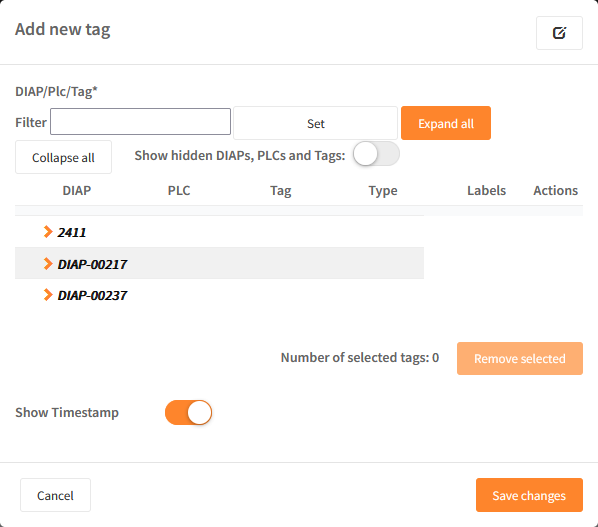
Data has to be selected to be added to be displayed in the graph. You can display multiple values in the same graph. Data selection can be found in the lower part of the popup window.
Field explanation
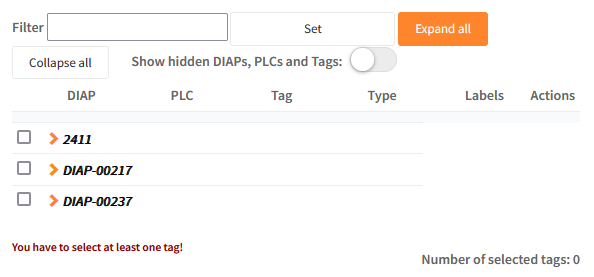
- Selection of data - expand the DIAP and select tag:
- DIAP: Select the DIAP that you wish to show data from.
- PLC: Choose PLC or sensor.
- Tag: Select the tag that you would like to visualize data from.
Press the 'Save changes' and the pop-up will close.
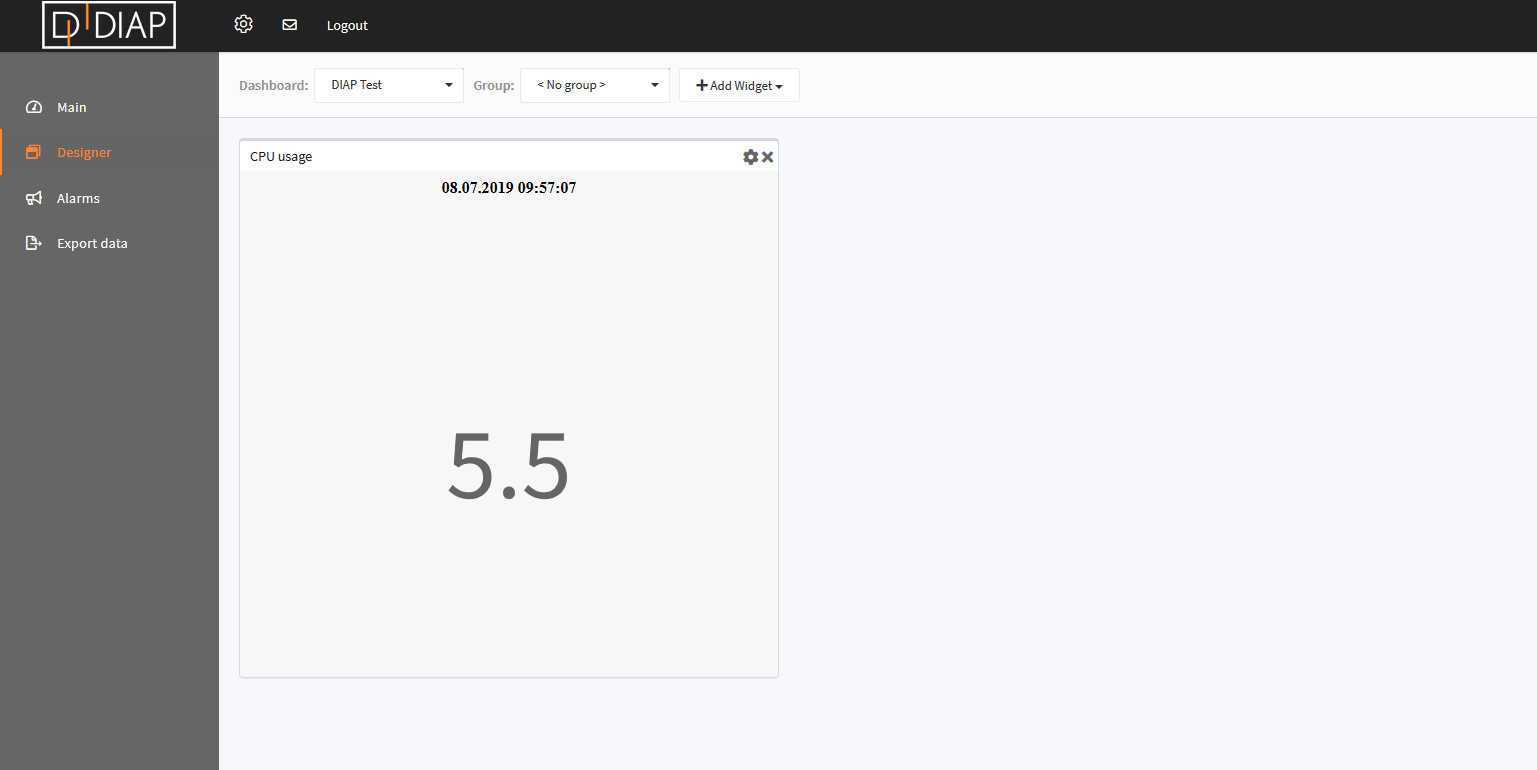
The widget will show the value of the chosen tag or sensor.