- A new widget has been added and is called "Data report". The idea is to have the possibility to see more information regarding what values has been changed throughout a time period or on a specific order. All the data will be connected to a master tag, which, for example, can be an order, product or similar. Additionally then it can be set to some interval, if no master tag is available.
An example could look like this: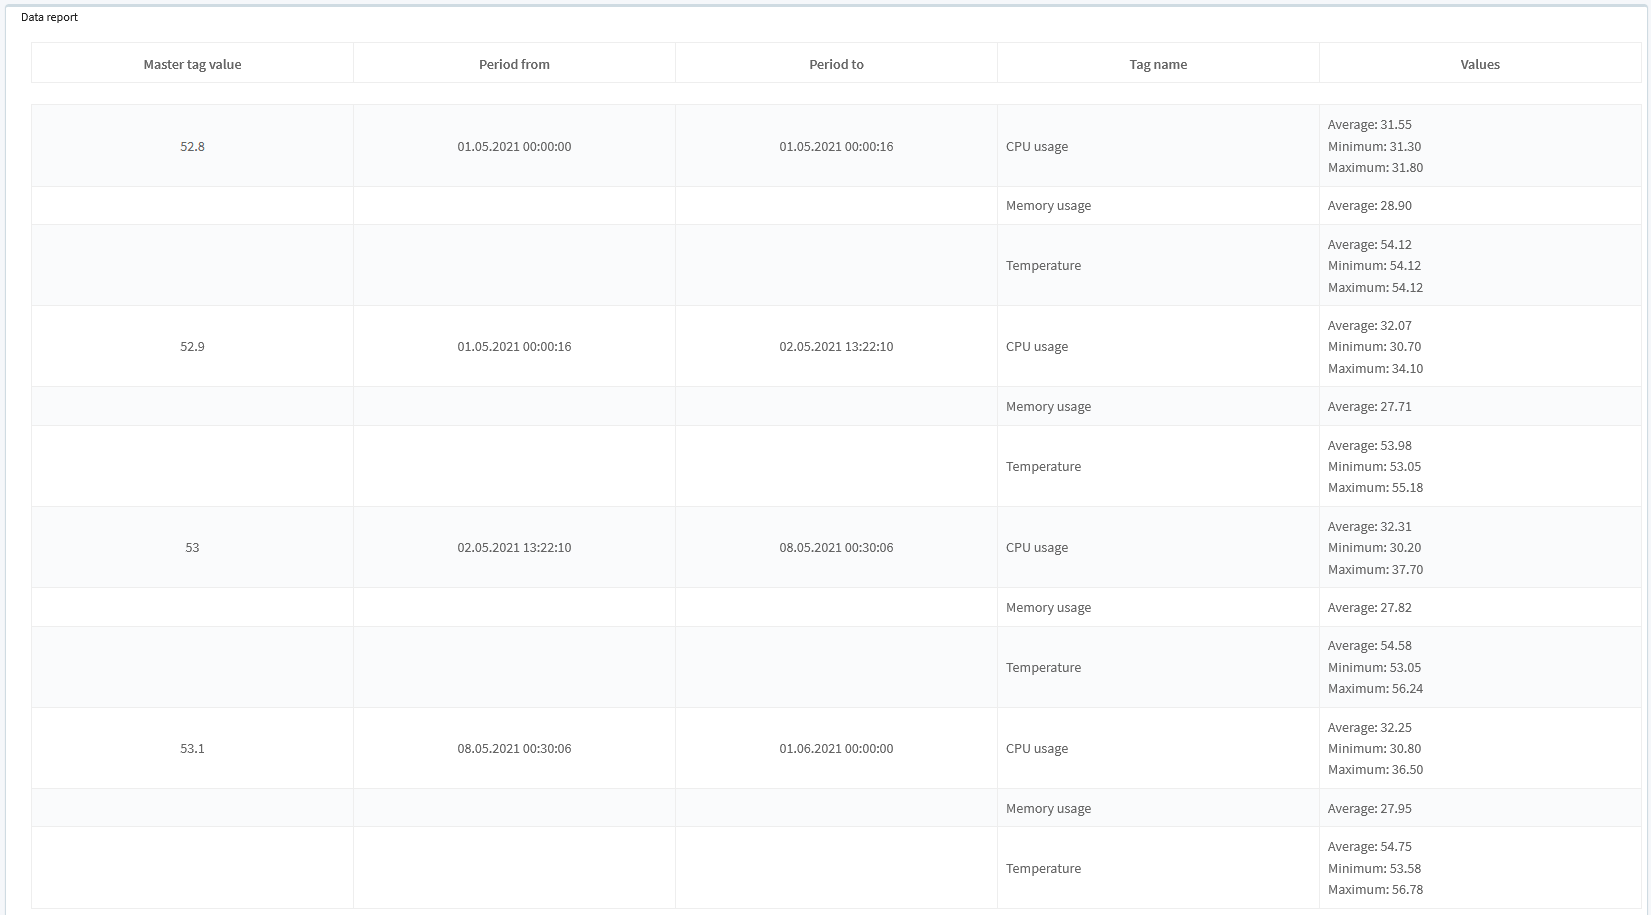
It is possible to set the sum, minimum value, maximum value, average and count for each of the tags depending on the master tag over the period of time chosen.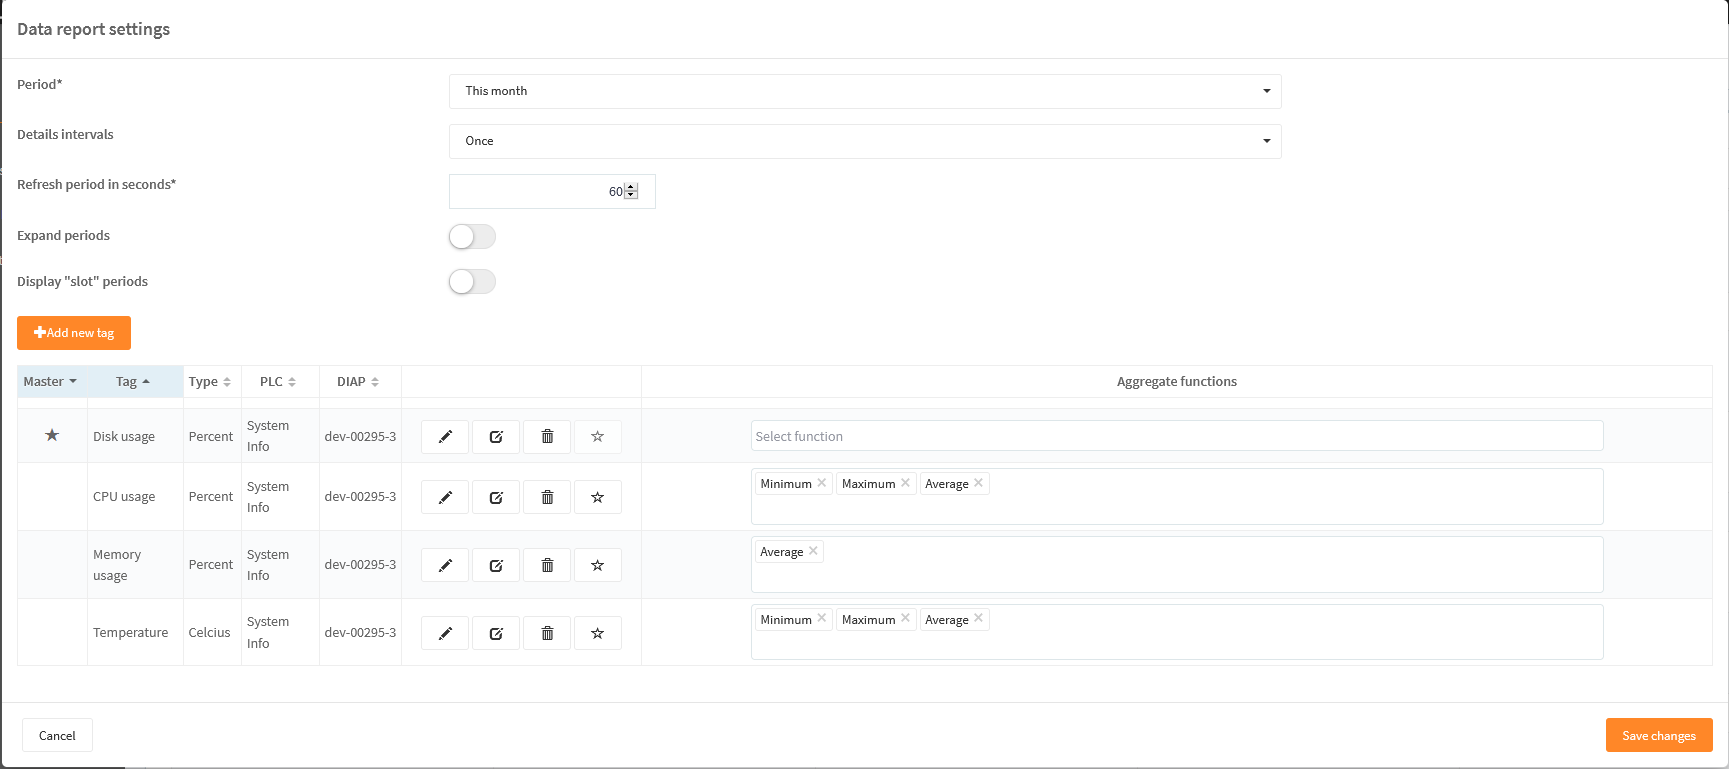
The new widget will be possible to find under "+ add Widget" under Designer. - Easier navigation of Line Graph, data tables and so on. Operators are now able to navigate in historical data - if the administrator lets them do it. The administrator has to choose under the configuration of the graph, that the operators should have access to the custom date filter under "Main".
This is the settings when configuring a new graph. A new setting has been added "Allow custom dates filter"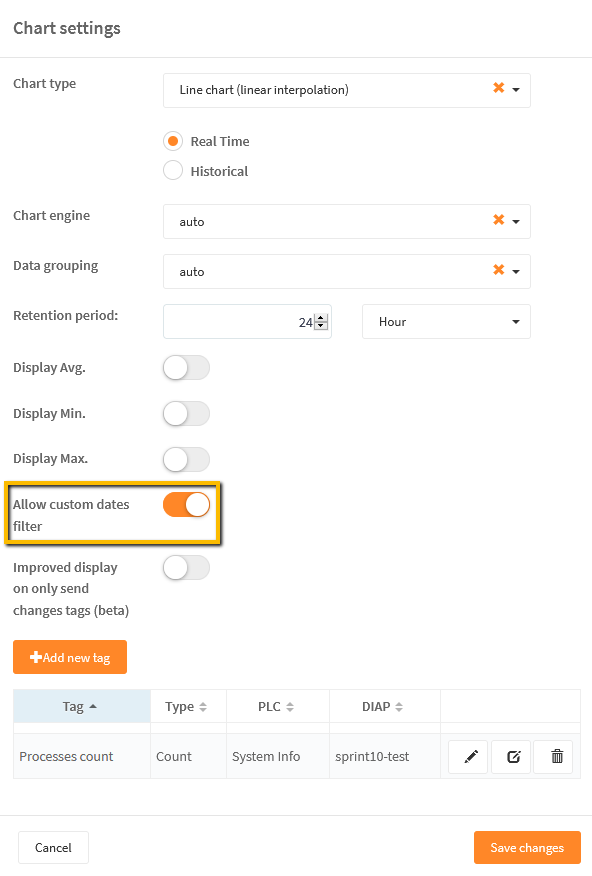
If this is enabled, then the operators will have access to the following on the "Main" page.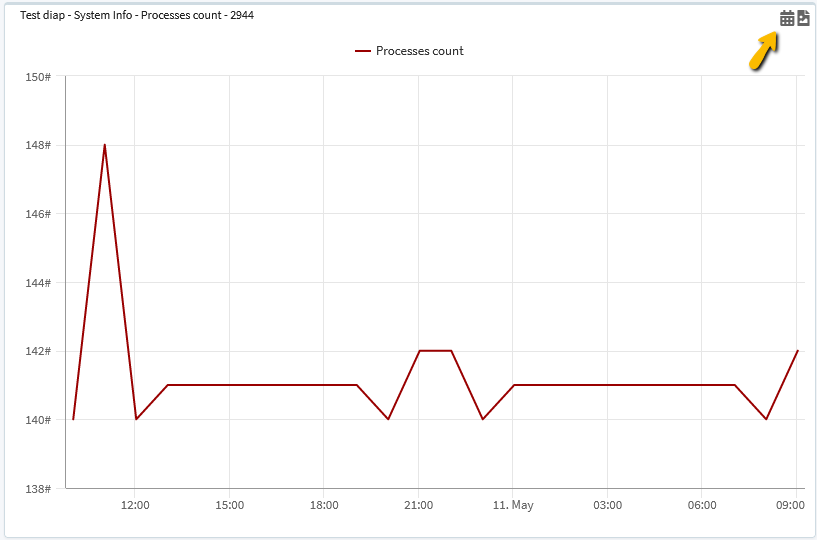
If the calendar is pressed under Main, then the following will be shown in the left side of the graph:
The operators and admins will now easily be able to search different time period depending on their wishes. = has to be pressed once the new dates has been inserted.
 = will revert the graph to the original settings.
 = will close the new date selector.
Once a new period has been entered then "zoom" possibilities will be shown under the graph in order to make it easier to navigate the period.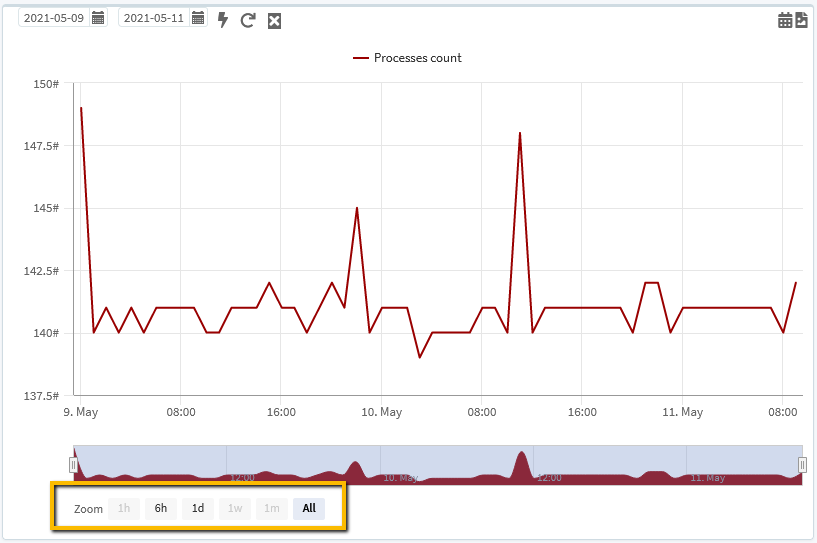
- It is now possible to export to directly to Excel from data tables
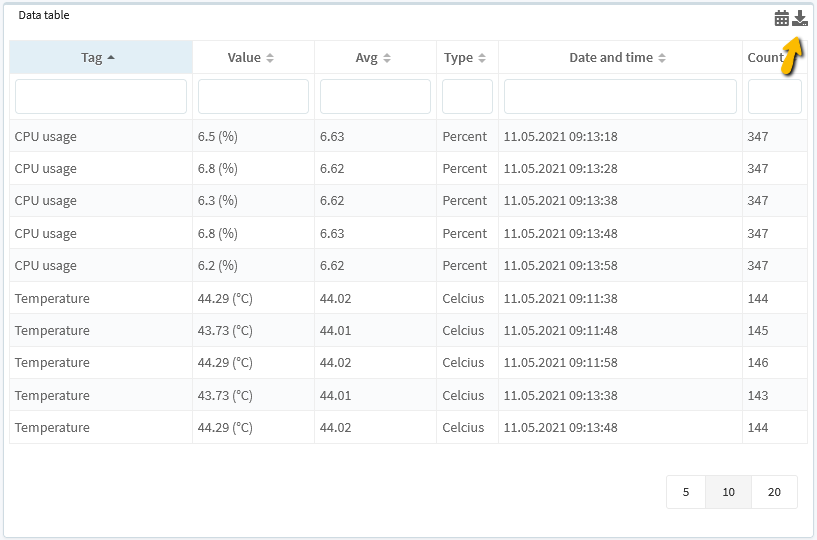
Once has been pressed, then a Excel will be generated with the data from the table.
An example of an export to Excel: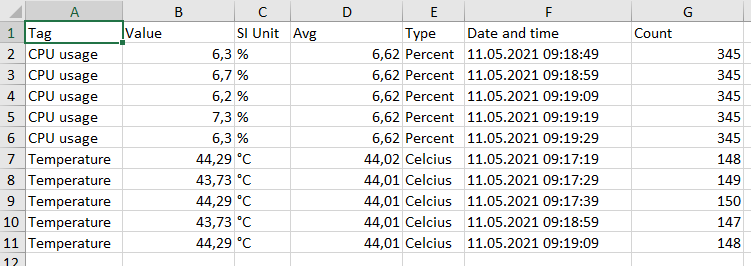
- Furthermore then it is now possible to determine size of columns in data tables. This can be done by configuring the data table which will now contain the following new settings:
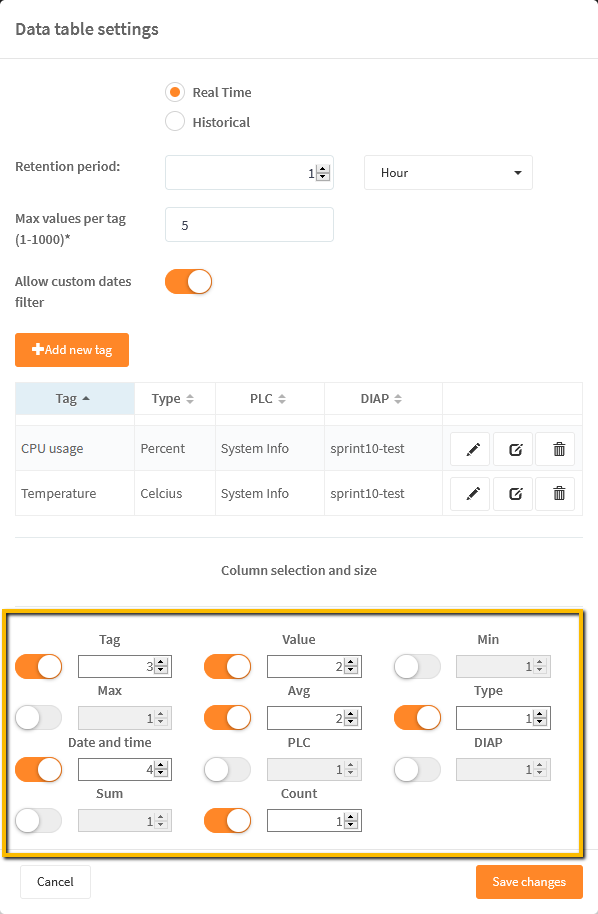
The numbers will indicate how much space each of the field has to be in relation with each other. Any numbers can be used in this to determine the size of the columns.
An example: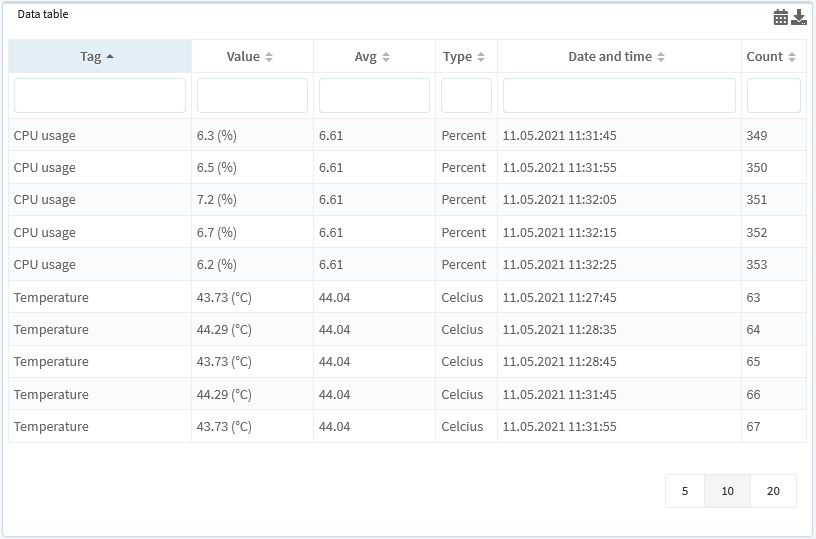
- A new widget has been added "Active alarms". It is now possible to easily see which alarms are still active and which are not.
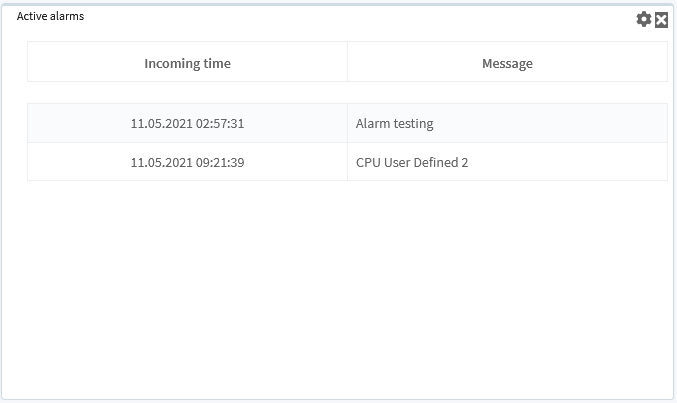
Only the active alarms will be shown in this widget. Once the alarm is no longer active, then it will not be shown in the widget anymore.
Incoming time will be since when has the alarm been active.
Message will represent the name of the alarm. - DIAP version 32 enables the possibility for the DIAP to count and summarize digital signals, flows and much more.
- Various optimization and bug fixes has been implemented.
Depending on the browser then it may be required for you to clear your cache in order to see the latest functionalities.
If there are any questions to this update, then please contact support@dataintel.dk.