- Old widget adding of new widgets mechanism is replaced with a new. modern looking, more intuitive and more understandable window:
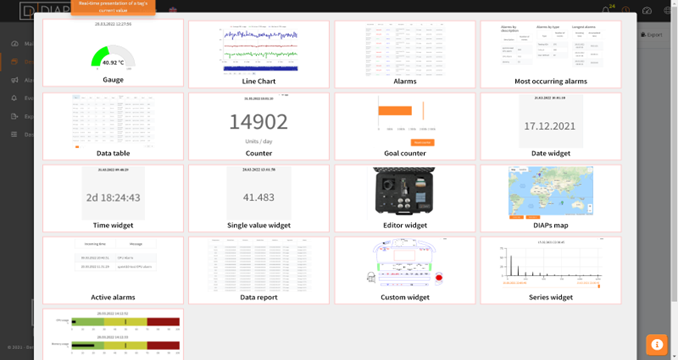
Even if you're not sure what is the purpose of each of the widgets, just hold the mouse over one of them for a few moments and extra explanation will pop up.
- New way of DIAPs/PLCs/Tags selection
Up to now, the tags selection functionality was slow, unintuitive, often confusing, so finally it is replaced with a new mechanism that will help even non-experienced users a lot.
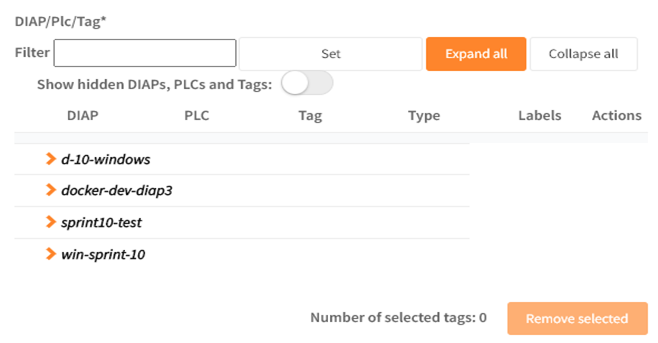
All the DIAPs, PLCs and tags are now visible at once, but, for the better overview, they are listed in an expandable tree view, where all units belong to their containers. Initially, only the active units are listed, but this can be changed using the switch “Show hidden DIAPs, PLCs and Tags” on top of the list (caution: if you have a lot of inactive units, fetching them might tale some time, so please be patient).
Using the top right buttons you may expand or collapse the complete list at once, but if you have a lot of units, the list may be longer.
Other possibility here is that you may filter the data, so if you enter some text in the Filter field and hit the Enter button or click on the Set, all units containing the entered text will be shown, together with their containers. To remove the filter, you should clear the filtered text and click again on Enter or Set button.
Depending on the widget type, you may select one tag, several tags or any unit from the list. All three possibilities will have different visual look. If you need to select only one tag (i.e. for the gauge widget), then only tags will have a radio button on the left side of their names, meaning that only one can be selected at a time. If you can select more of them (i.e. graphs), then all units will have check boxes on the left side of their names. If you check one container, like DIAP or PLC, then all tags that belong to them will be automatically checked. The number of the selected tags is visible in the lower right corner. Next to that information is a button that will remove all selected tags. The last option is when you may select any unit, but only one of them (i.e. alarms), then all units will have radio button on the left side, and only one could be selected. Also, for better layer navigation, all container names that contain one or more selected units, will have a grayed name. This is useful when you'll edit widget settings, so immediately you will be informed where the selected tags belong.
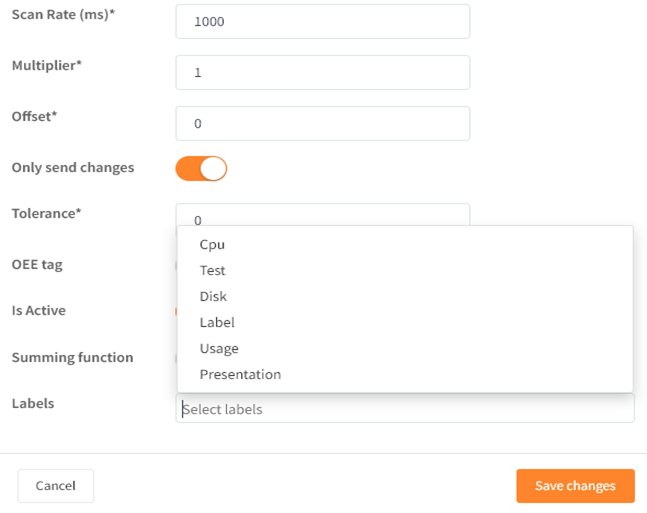
Additional options that you may find here are labels, a new functionality also included for the first time in this release (will be described later) and different buttons or additional settings, depending of the widgets. At least, one functionality, tag settings button, will be available for all tags, for faster tag settings modifications.
- With in configuration of tags, tags labeling has been implemented: To ease the search/filtering of the tags in the new tags selector, all tags now may be labeled. For every tag now you may enter a new label, one or more of them, or choose from the list of already used labels. Mixing old and new labels is also possible.
- Copy/Move widgets to another dashboard
While in the dashboards designer mode, all widgets can be moved or copied to another dashboard. To access this functionality, you need to click on the right arrow visible in the top right corner of every widget 
After clicking on it, a new dialog will appear:
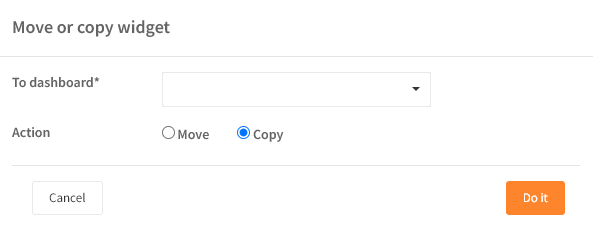
Here you need to select the target dashboard and an action, which can be moving or copying the selected widget. If you choose copy to the current dashboard, then the widget will be duplicated.
- Grouping dashboards into categories is another functionality included in this release.
To access this functionality, there is a new menu item in the real time group, called Dashboard categories. Clicking on the menu, a new window will appear, divided in two parts, for categories and attached dashboards.
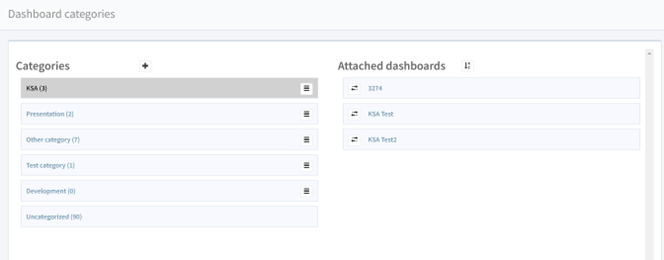
All existing dashboards and the new ones (if not stated differently) will be “uncategorized” and this “category” will always be the last on the list. To add new category, you need to click on the + button next to the Categories caption, after which a dialog for entering the name will appear. Every category have several options, available when you click on the button on the right side of each category name.
There are several options, like move up or down, to reorder the categories, rename option or delete option. If you choose to delete the category, all belonging dashboards will be transferred to uncategorized. The number in the parentheses following the category's name shows how many dashboards belong to that category.
When you click on some category, on the right panel all dashboards belonging to that category will be listed. Initially, they are alphabetically ordered, but you mat change it, using the button on left of the dashboard name. There is also a possibility to transfer the dashboard to some other category, where it will be inserted at the end of the list. You may again rearrange the dashboards alphabetically if you click on the sort button on the right side of Attached dashboards caption.
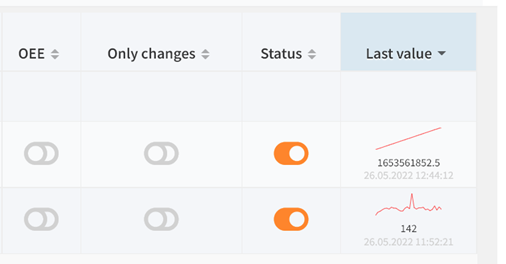
- All switches on the DIAPs, PLCs and tags overview pages are now functional. If you click on them, a confirmation dialog will appear and if you confirm changes, they will be automatically applied.
- Notifications: next to the clock icon in the upper right corner there is a new icon, a bell. All notifications that occurred in the current day, altogether with the new notifications, containing newly raised alarms, device malfunctions and so on, will be presented here. If you click on the bell, a list with the most recent alarms will be presented (10 at most). There are buttons to see all of them and to dismiss one by one or all at once. To close the list, you need to click again on the bell. If there are some notifications, their count will be visible as a number in the top right corner of the bell.
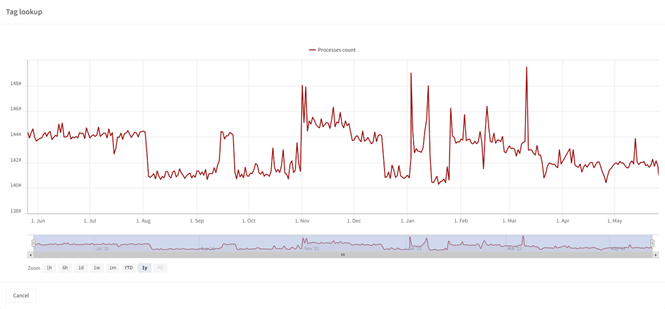
- Within configuration of tags, tags sneak peek has been implemented, when editing tags, the last column now represents the sneak peek of the last values for that tag. If you click on the image, the new window will appear with the last values of that particular tag.
Depending on the browser then it may be required for you to clear your cache in order to see the latest functionalities.
If there are any questions to this update, then please contact support@dataintel.dk.