The following updates have been added to OEE application.
1. Use external emails in subscription
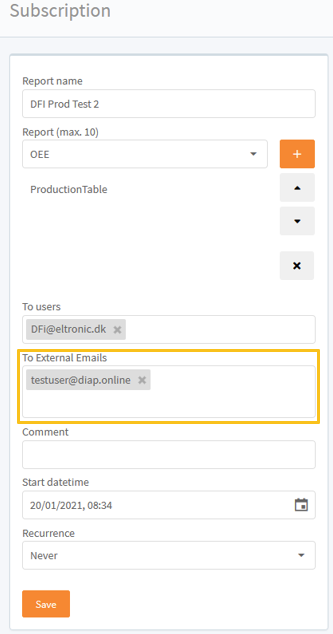
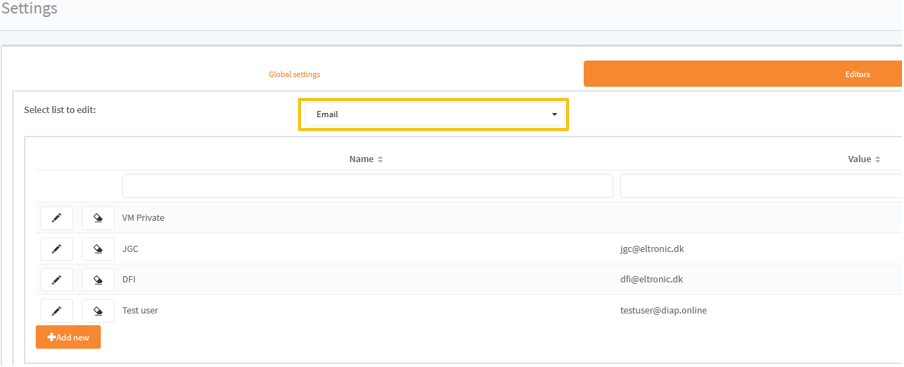
- In Reports->Subscription, To external emails has been added, were you can select emails, that are not tied to a user in the users list on the live site, to also receive the reports.
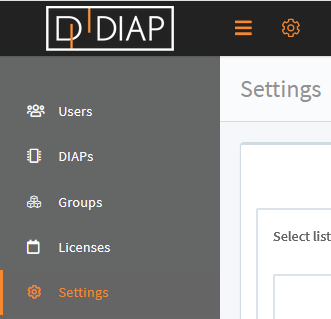
This list of external email, can be found on the live site under Settings, click tab Editors and select Email under list to edit:
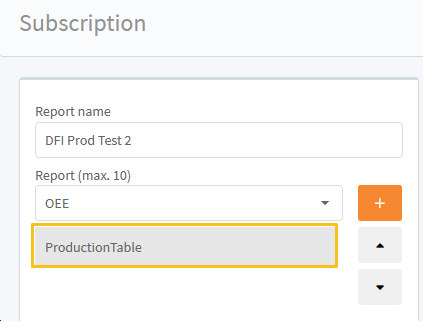
2. ProductionTable report added to Subscription
- In Reports->Subscription, ProductionTable is a new report, where you can summarize your OEE and DIAP tag data into periods and see the correlation between your OEE and DIAP tag data.
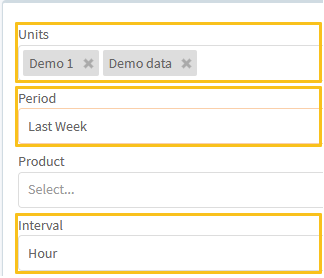
Select your Units, Period and Interval, the report, should cover:
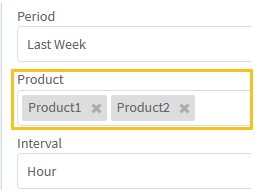
You can filter the result on the products, you are interested in:
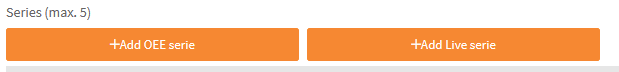
You can have up to 5 series in a report. There are 2 serie types OEE and Live. The OEE serie presents OEE numbers and OEE related numbers and the Live serie present the data collected from a DIAP tag:
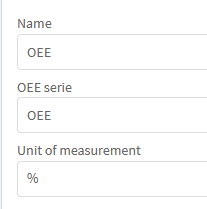
- OEE serie: Name is the name of the series, OEE serie is the OEE data in the serie and Unit of measurement is an option for you to add a unit of measurement to the numbers.
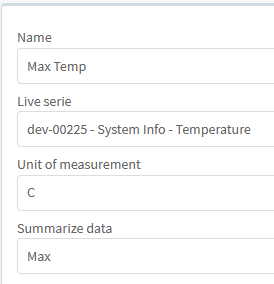
- Live serie: Name is the name of the series, Live serie is the DIAP tag data in the serie, Unit of measurement is an option for you to add a unit of measurement to the numbers. Summarize data is the function used to summarize the data for the period, the options are Sum, Average, Min, Max and Difference between min and max:
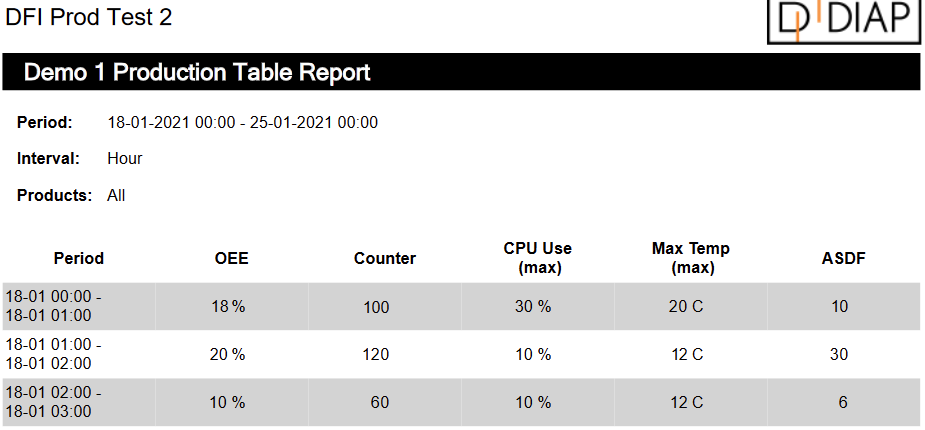
In the mailed report, the header of the report will show the period, that is covered, the interval that the period in sliced into and the products, that the data is filtered after if used. The data will be shown in a table. Each series will be represented by a column in the table, the name of the series will be in the header of the table and if it is a Live series, the summarize function will also be shown in the header. The unit of measurement will be shown after the number in the table if used.
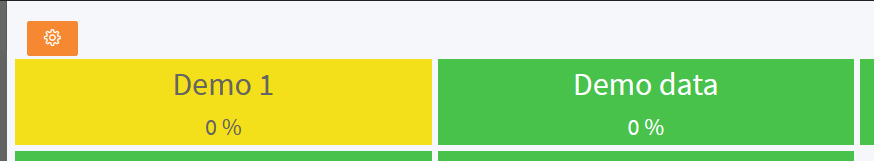
3. Shifts Overview
- A new view is added the Shifts Overview. In Views->Shifts Overview you can view the OEE number for the current and last shifts on a unit.
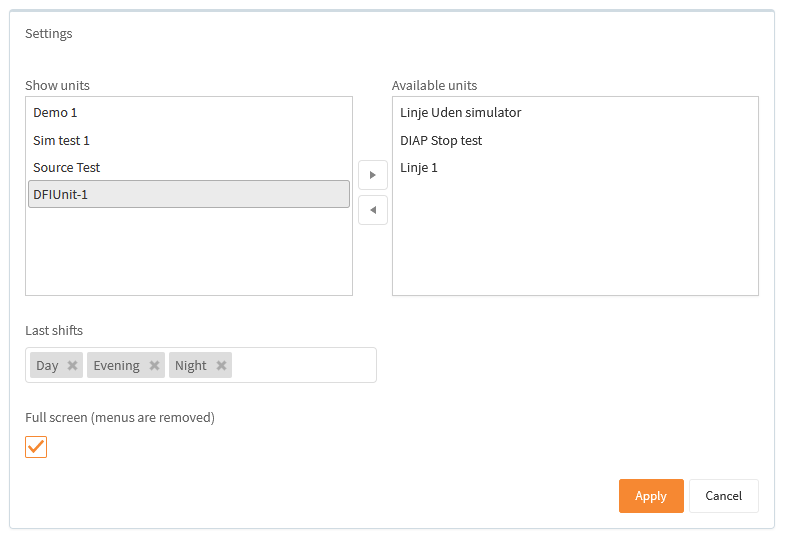
In the configuration for the view you can select the units that should be shown, the Last shifts type that should be shown and select if a full screen should be used(Menus are removed):
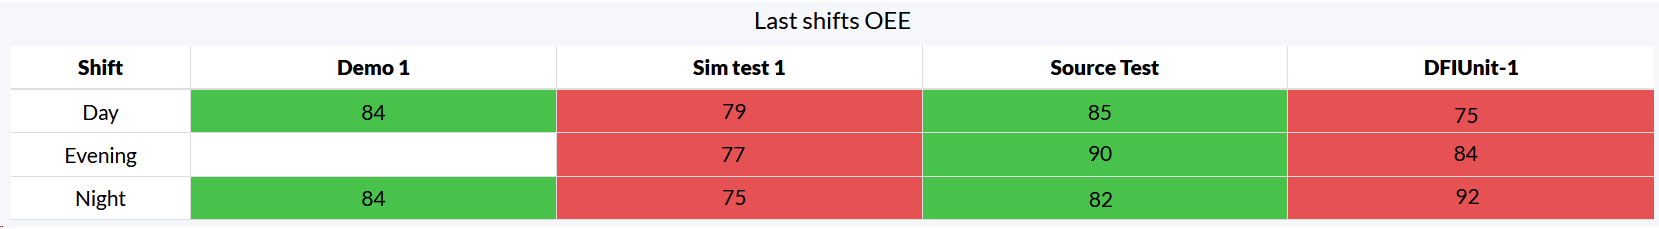
The Last shift table shows the OEE number for a last shift on a unit. The cell color is green, if the cell value is equal to or greater than the OEE target for the given unit, if it is less, then the cell color is red:
(Blank cells means, that the given shift type, isn't setup in the shift schedule for the unit)
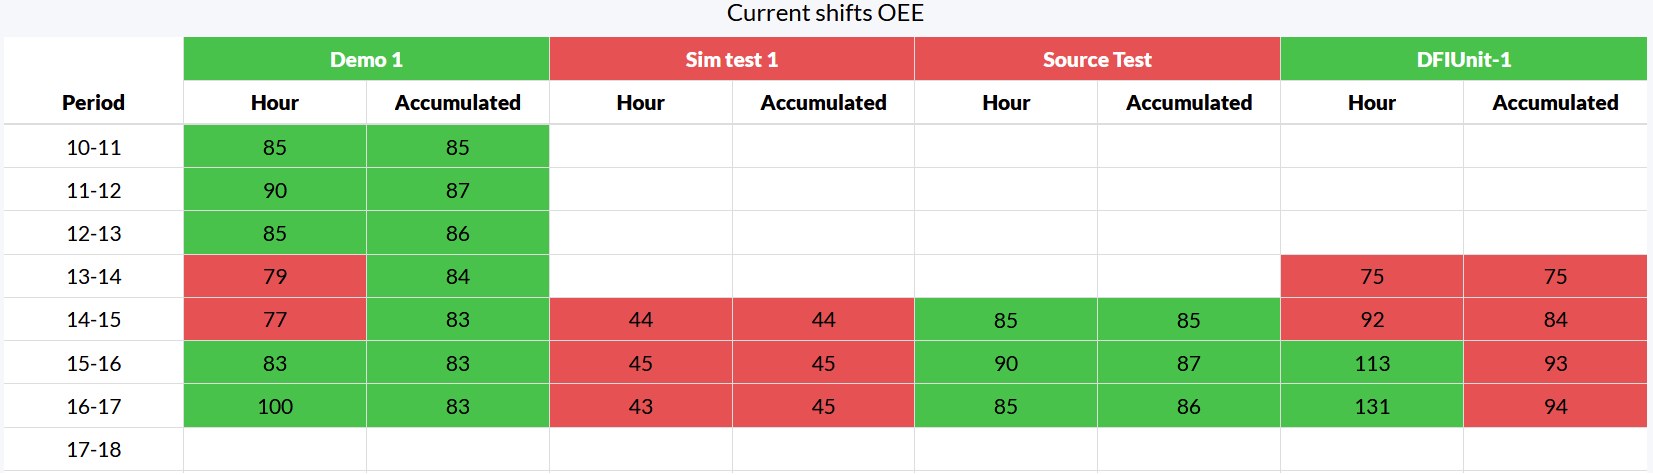
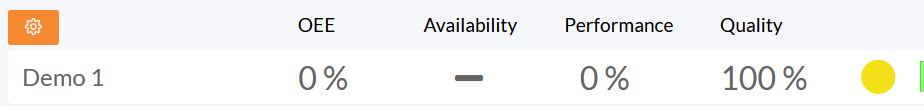
The Current shift table shows the state on a unit by the cell color. Green is shown when the unit is running, red is shown, when it stopped in a PlannedStop or UnplannedStop and yellow if it is in a InfoStop. The color can also be the stop causes color. See Use stop cause as state color:

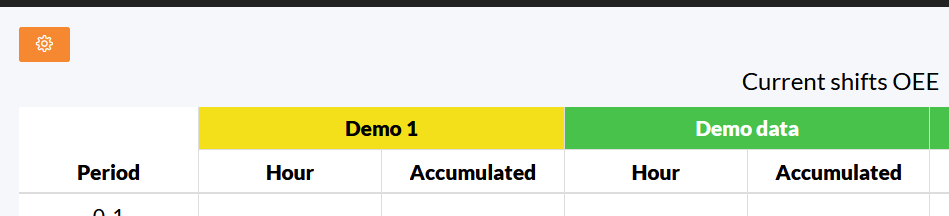
The Current shift table also shown the OEE numbers for the current shift on a unit. There are 2 OEE number shown per row in the table Hour and Accumulated. Hour shows the OEE number for the given period and Accumulated shows OEE number from the start of the current shift til the end of the given period. The cell are colored after the OEE target for the given unit:
(A blank cell above a non blank cell, means that the period for the unit, is not part of the current shift. A blank cell below a non blank cell either means, that the current time hasn't entered into the given period or it isn't part of the shift)
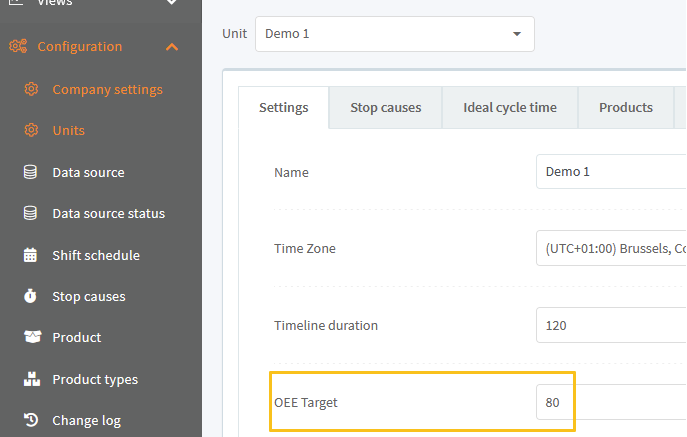
You set OEE target for a unit in Configuration->Units.
4. Use stop cause as state color
- In Configuration->Stop causes, the stop causes, now have a Use as state color value:
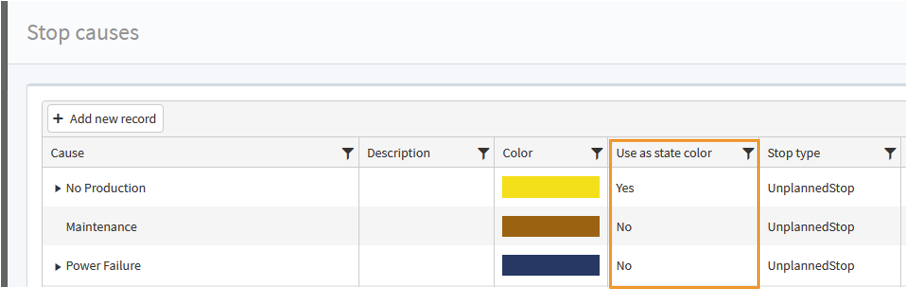
Setting this to Yes, will have a unit use the stop cause's color in its state, when it is in a stop of that type.
You can see this in Views->Operator: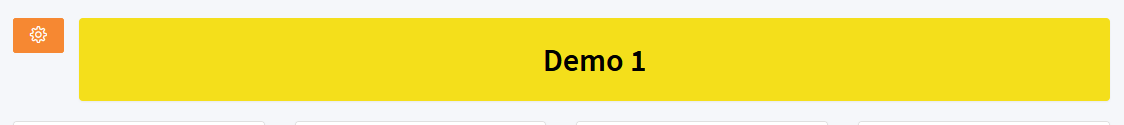
and Views->FactoryView:
(Line)
(Grid)
And Views->Shifts Overview:
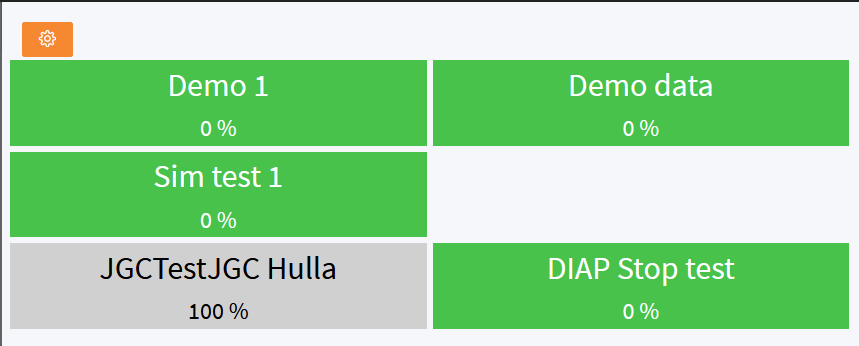
5. Break line in FactoryView's grid
- In Views->FactoryView in the configuration, you can now drag 1 or more (Line break) into Show units:
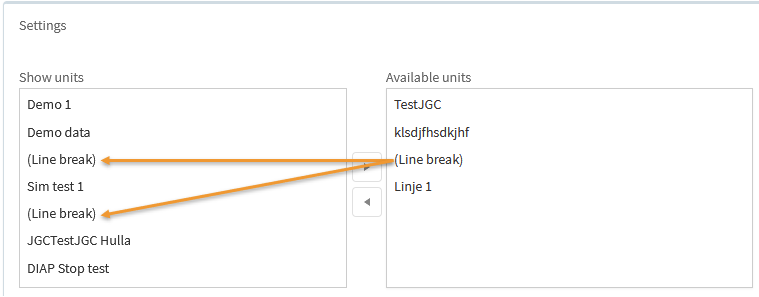
This will break the line in the grid view and show the following unit on the next line.
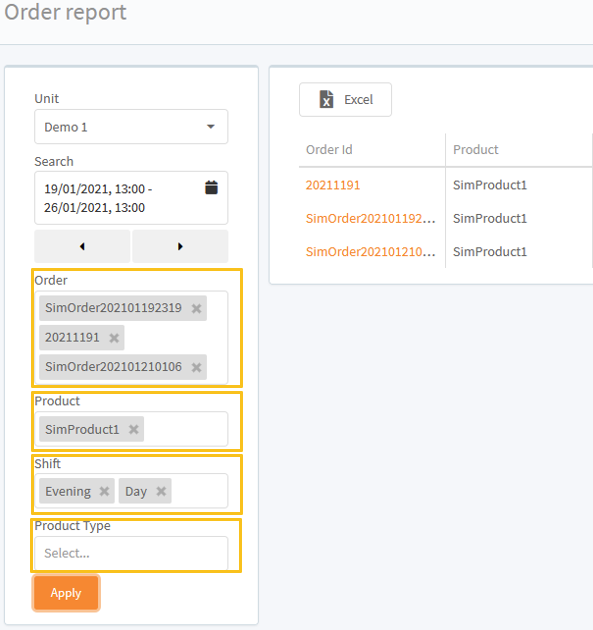
6. Select multiple values in report filters
- In Reports->OEE, OEE waterfall, Stops, Stops causes, Stop history, Order and Period. You can now select multiple values, in Order, Product, Shift and Product Type, to filter your result:
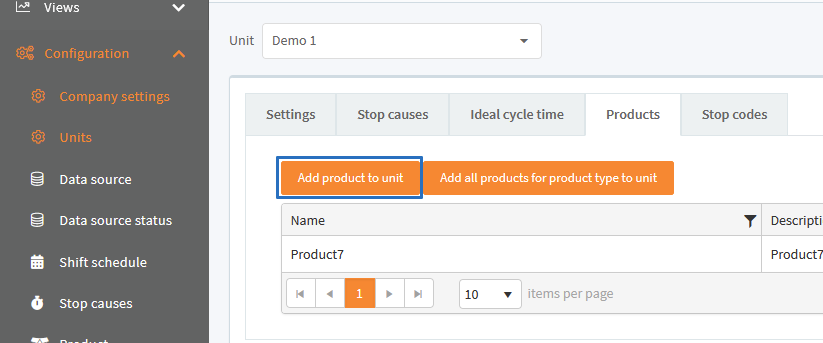
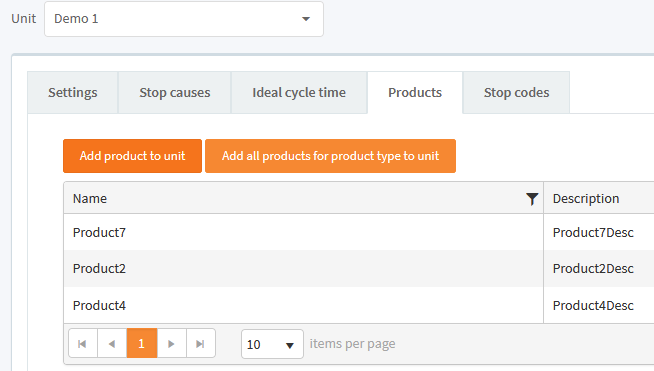
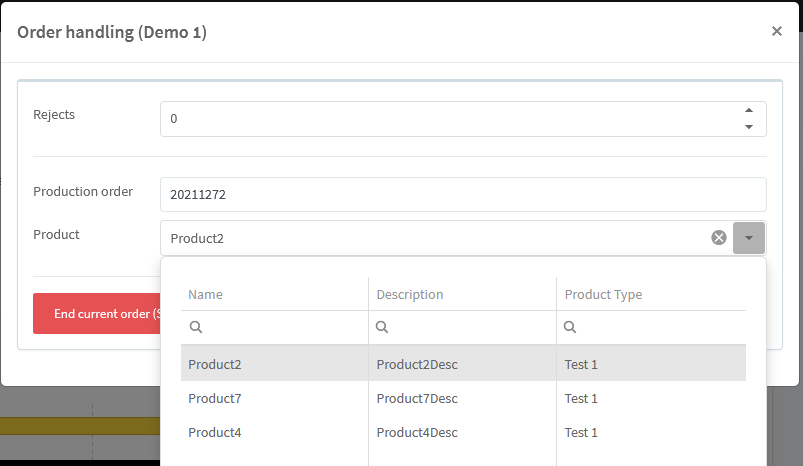
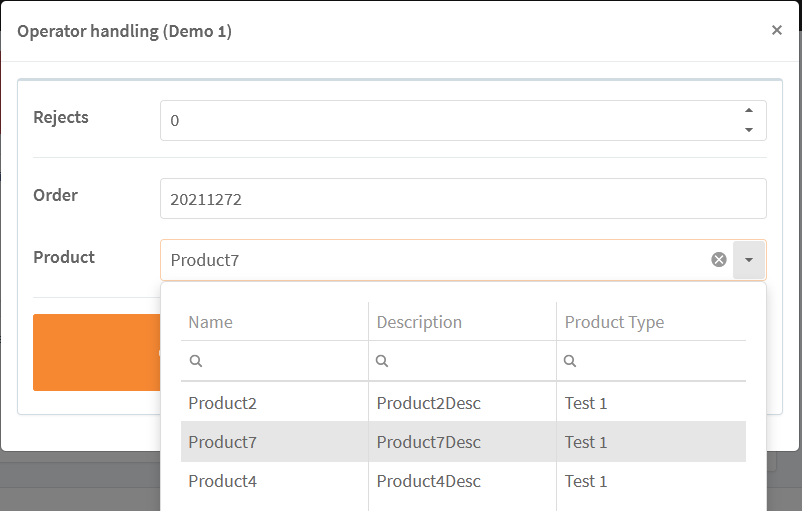
7. When starting or changing an order have a filtered product list by adding products to a unit
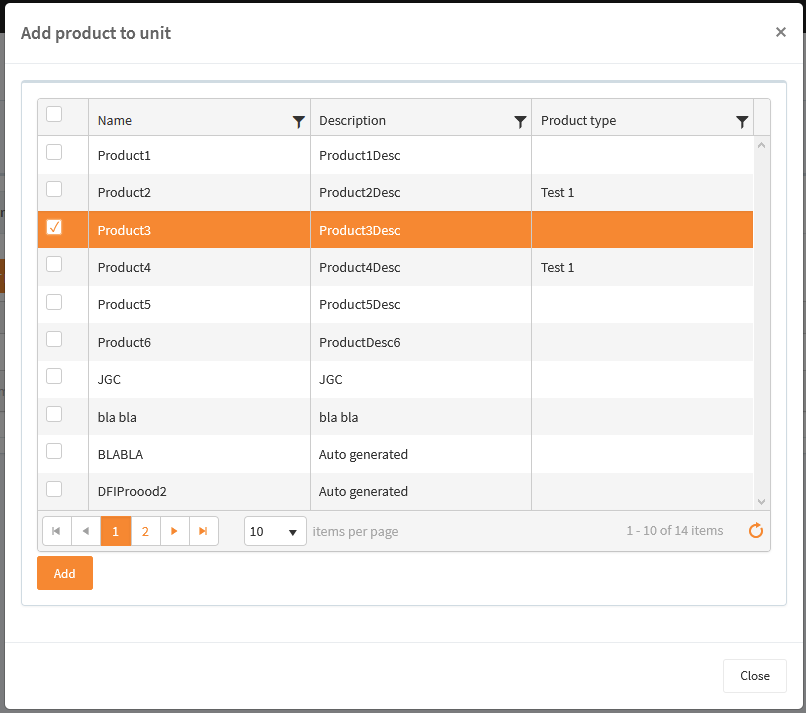
- In Configuration->Units, where is the new tab Products, where you can bind a product to a unit:
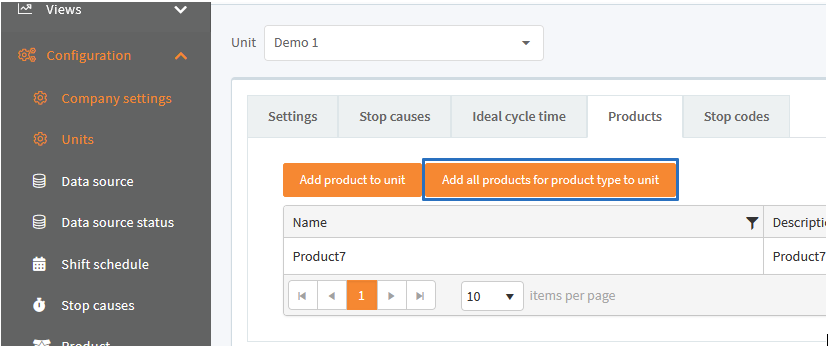
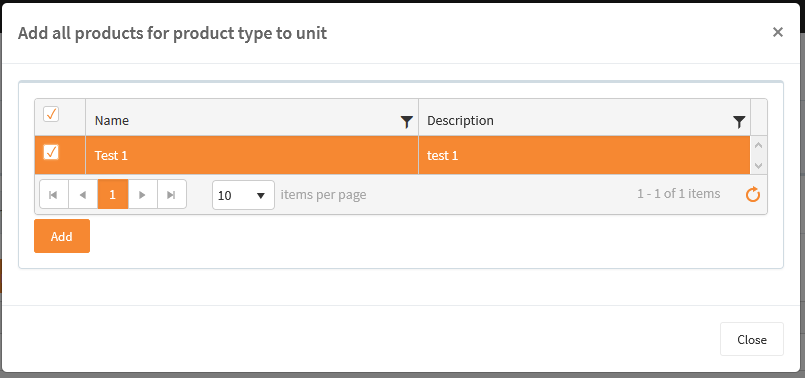
You can also add all products of a product type to a unit:
If you have added products to this list, then the production list for order changes on the given unit, will only show the products, which you have added:
(In Views->Production status)
(In Views->Operator, with a View that shows the order window)
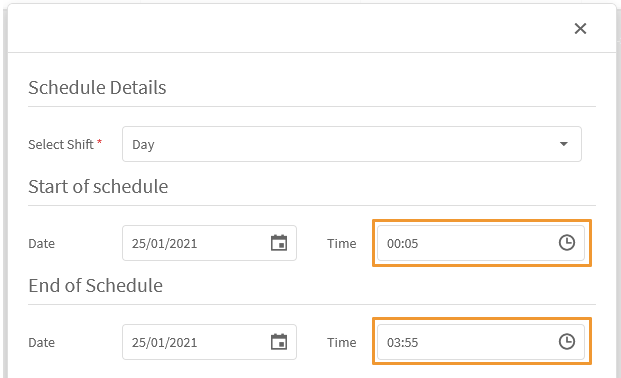
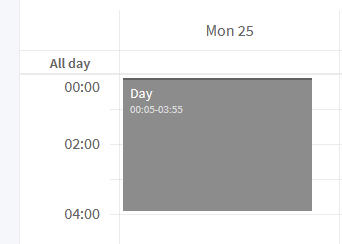
8. Shift schedule plan with 5 minutes resolution instead of 15 minutes
- In Configuration->Shift schedule you can now schedule shifts to start and end on a 5. minute in the hour now:
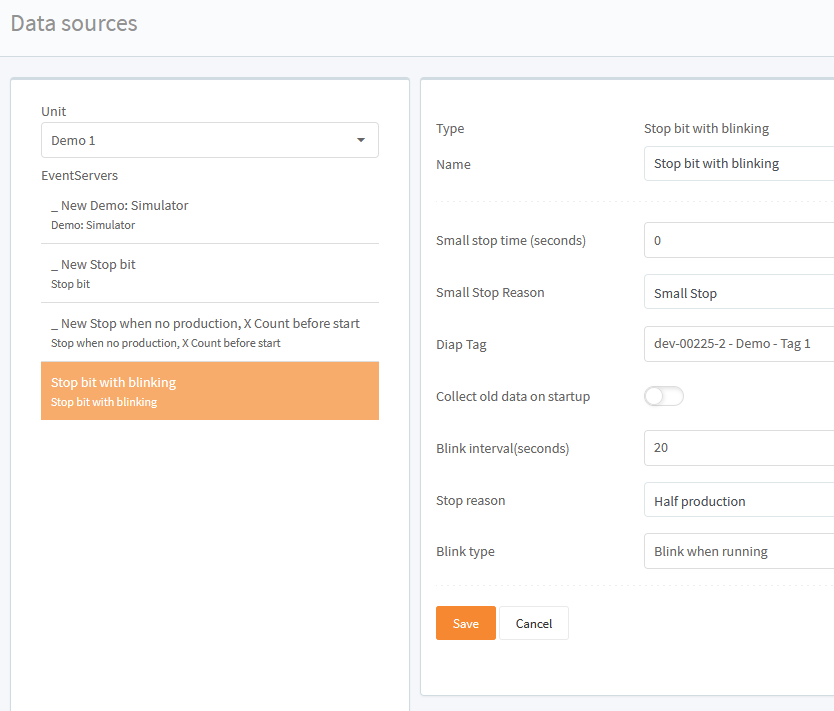
9. Event server Stop bit with blinking
- In Configuration->Data source a new event server has been added. Stop bit with blinking is a Stop and Run state service for a unit, where the service sets the unit's state to Run or Stop based on the data collected from a DIAP tag. This service is called blinking, because one of states should be map to a DIAP tag, that toggles it's value like a pulse(We call this blinking). So when the value is blinking the unit is put into the state that is map to the blinking state and when the value doesn't blink, the unit is put into the other state.
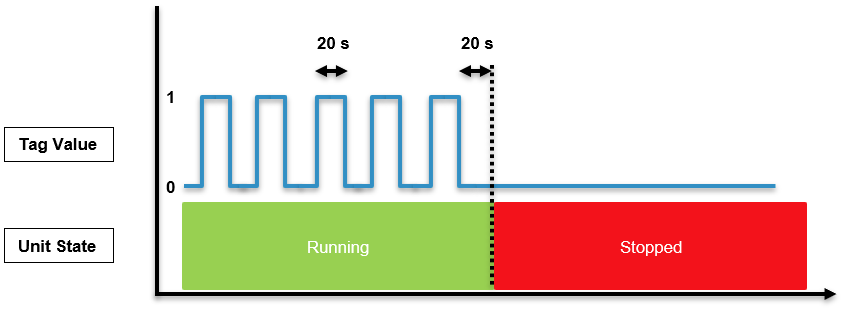
Below you see a setup, were the unit runs on a blinking value and stopped when the value isn't blinking. The Blink interval is how many seconds that may pass before the next changed value should occur to say that the value is blinking, if more time passes then the value isn't blinking.