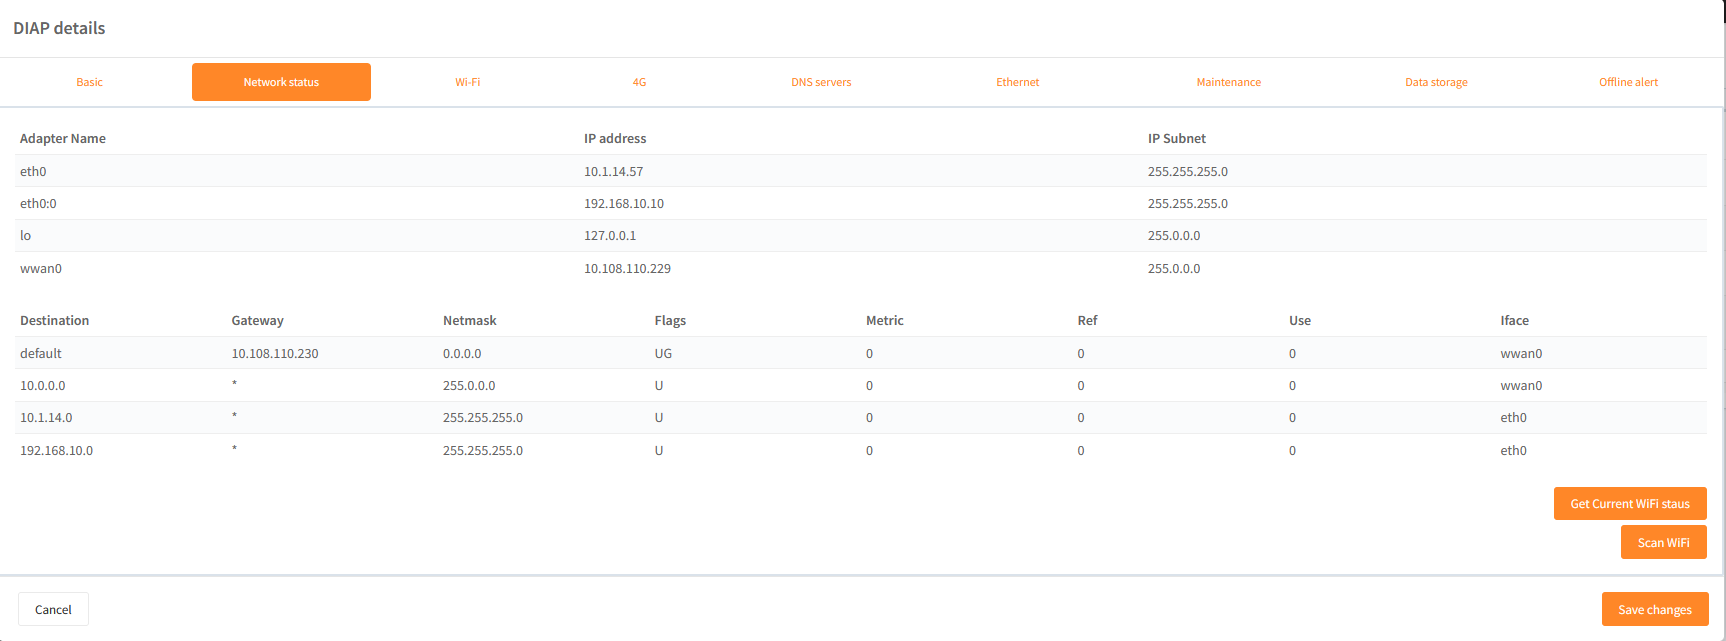
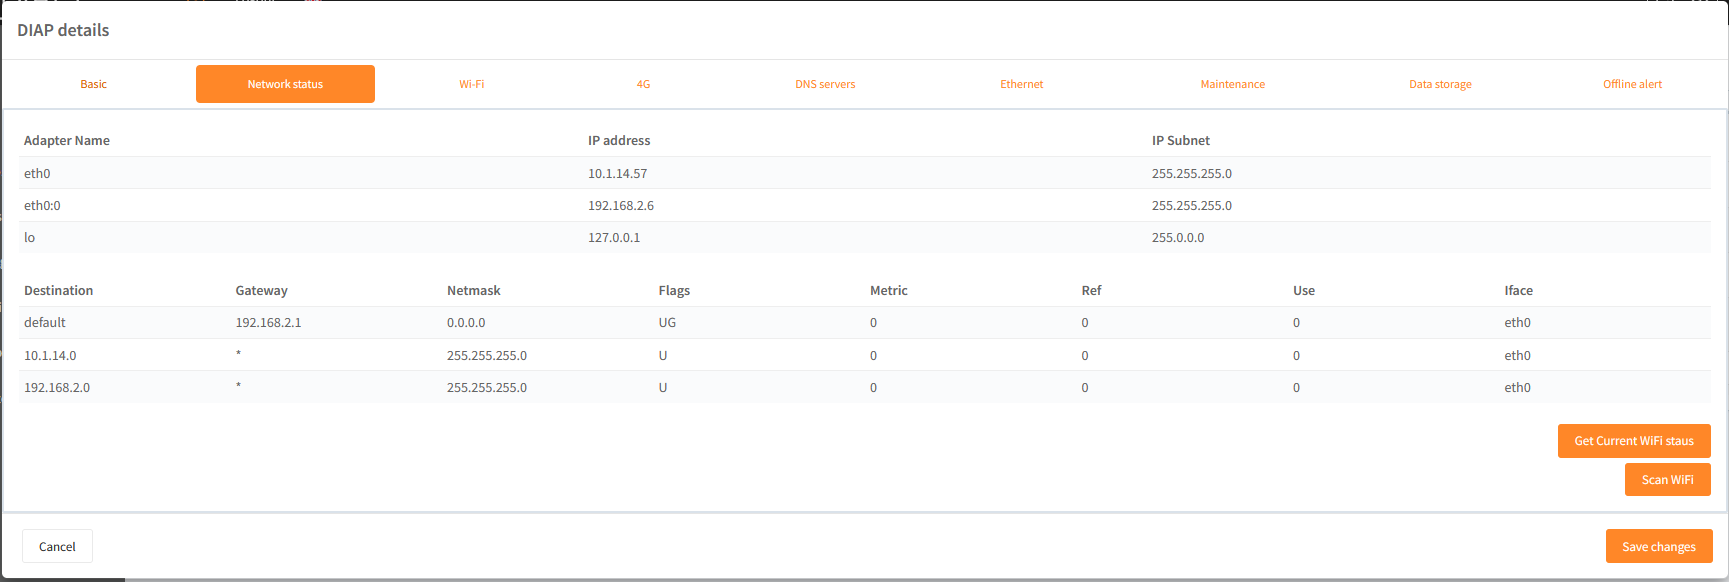
- A new window has been added to the DIAP configuration, which shows the network status of the selected unit. The functionality will enable the administrator to see the adapters setup on the DIAP, and thereby determine that the IP addresses are correct. Furthermore it is possible to get information about the strength of Wi-Fi and scan for nearby Wi-Fi's.
Functionality can be found under Configuration -> DIAPs -> Select the pencil button -> Navigate to the "Network status" window.
- Change log has been introduced under configuration, thereby making it possible to see all changes to configurations of company and DIAP settings. All additions, deletion and changes are visible within the change log page. Only administrators has access to this.
The functionality can be found under Configuration -> Change log
An example of information can be found underneath: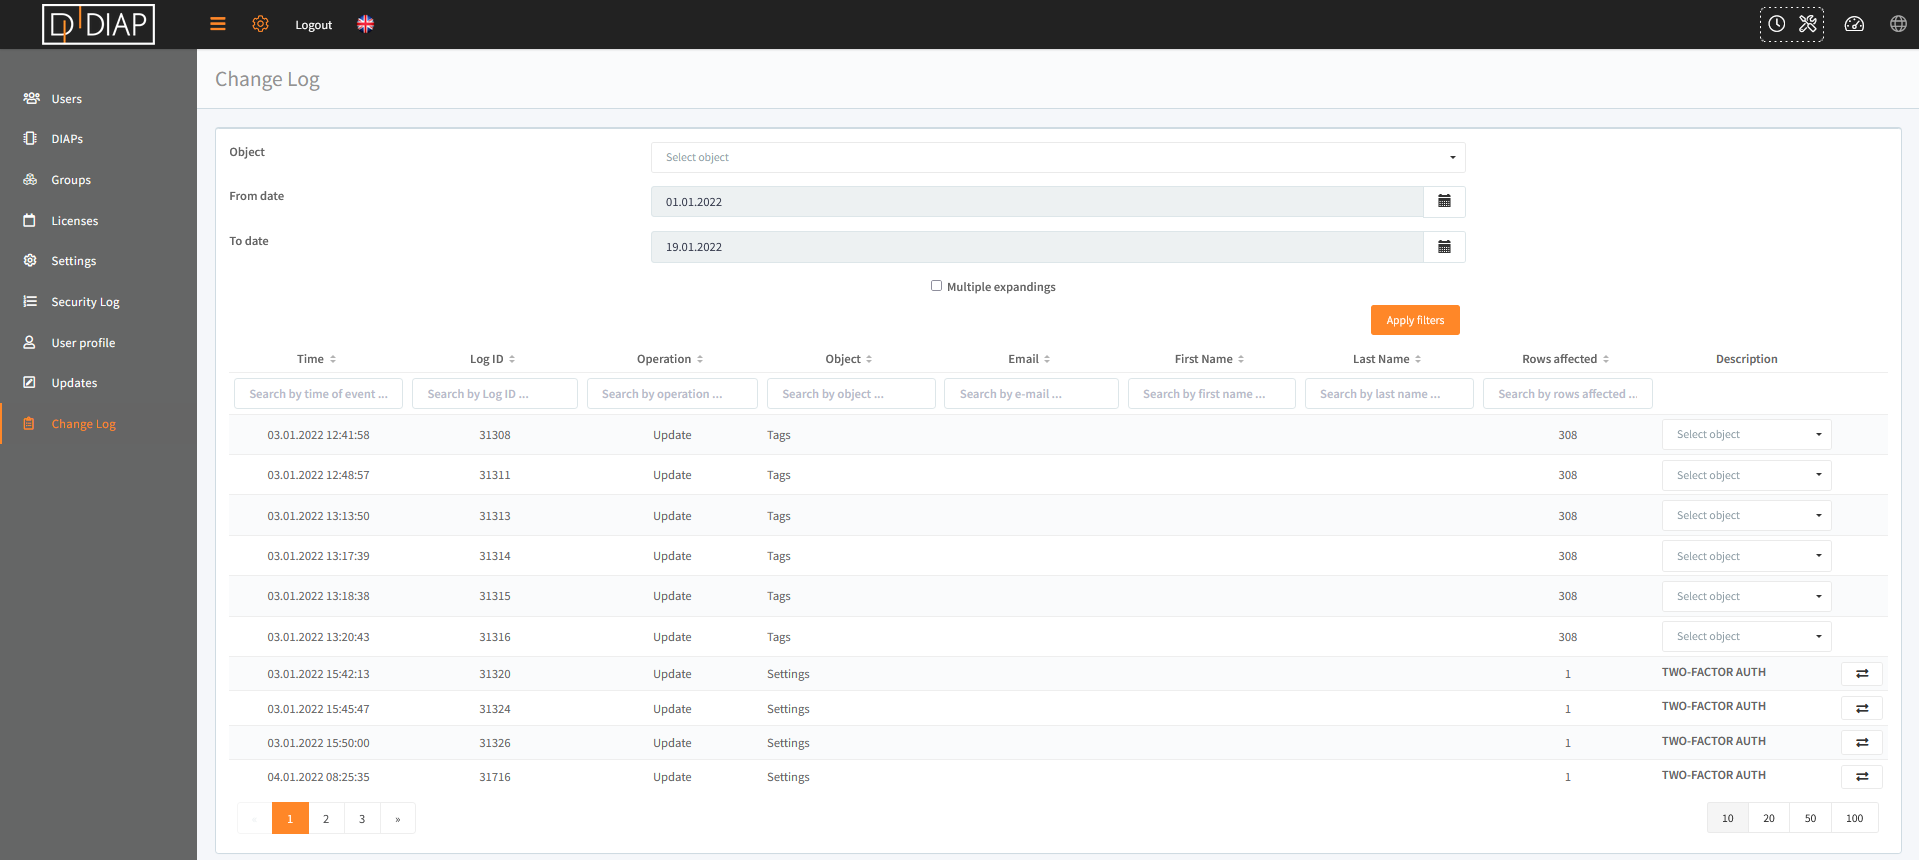 By pressing the
  the details of the change can be seen:
The screenshot shows that Two factor authentication has been enabled at 03.01.2022 15:42:13.
- PLC and tag export functionality has been expanded to include calculated tags. All tags are now able to be exported and imported in the same company and within other companies.
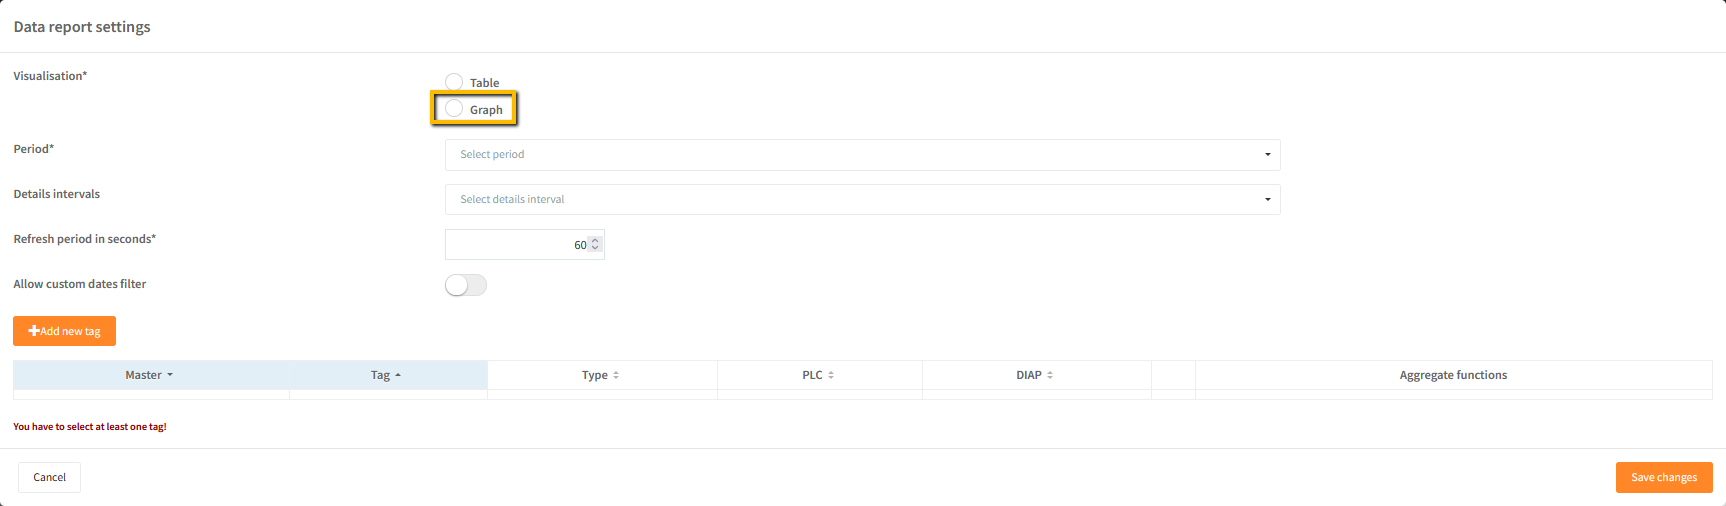
- Data report has been expanded with the possibility to show collected data as a graph - instead of earlier only having the possibility of a table.
Selection of functions can be: maximum, minimum, sum, average and count over a period of time. Details intervals can be hours, day and week.
Function can be found under Designer -> Add widget -> Data report -> select visualization "Graph"
Visualization could looks as shown in the example below:
Example is showing minimum, maximum and average for each hour the day before.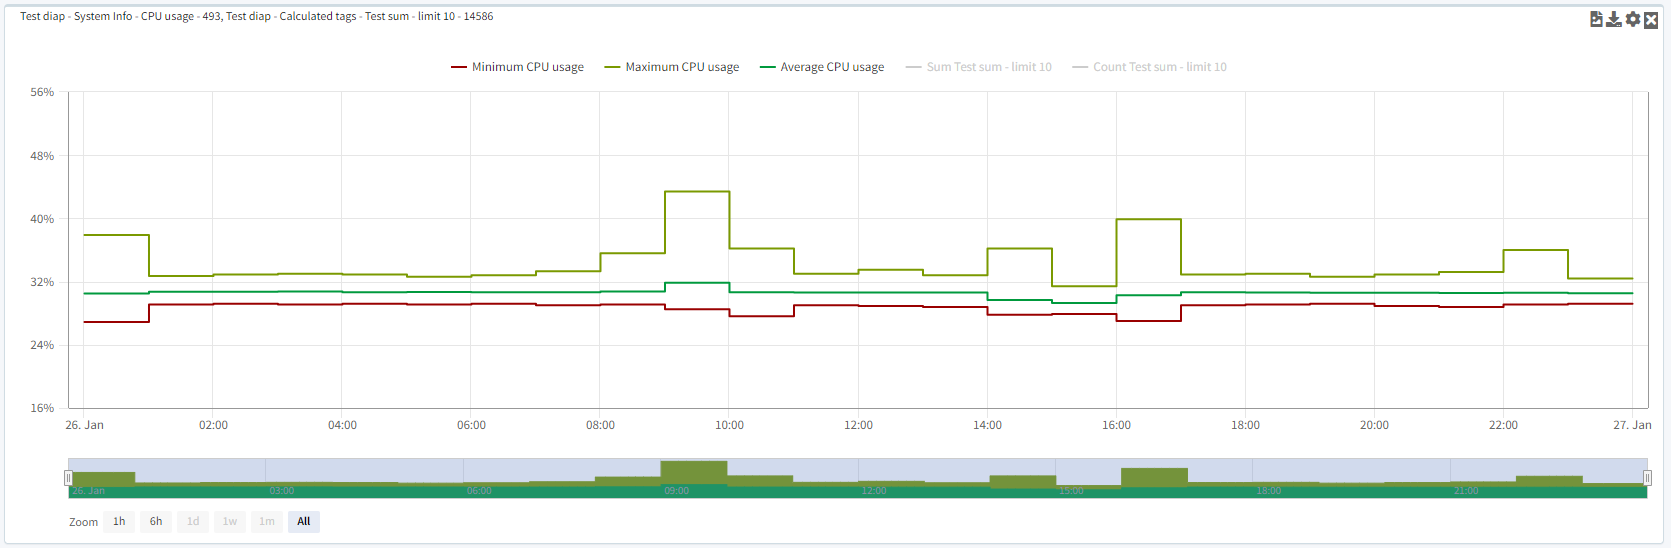
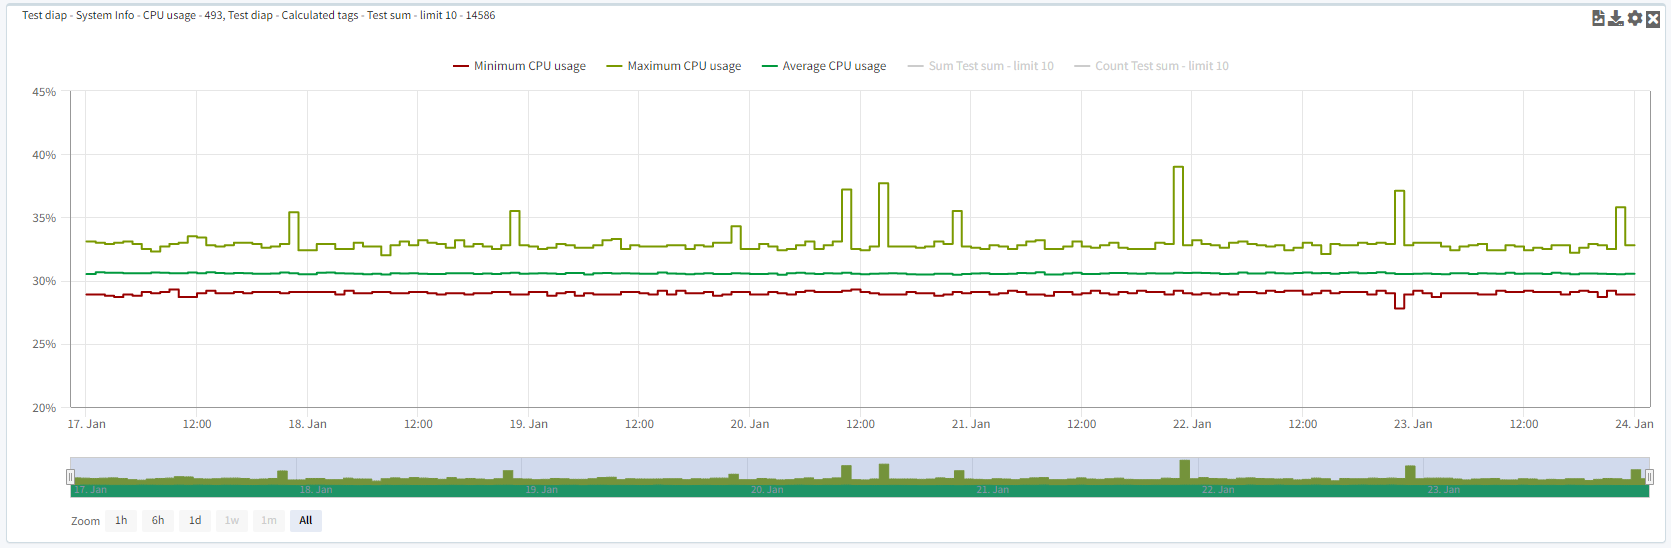
Example is showing minimum, maximum and average for each hour from the week before.
Example is showing sum of all readings for each hour the day before.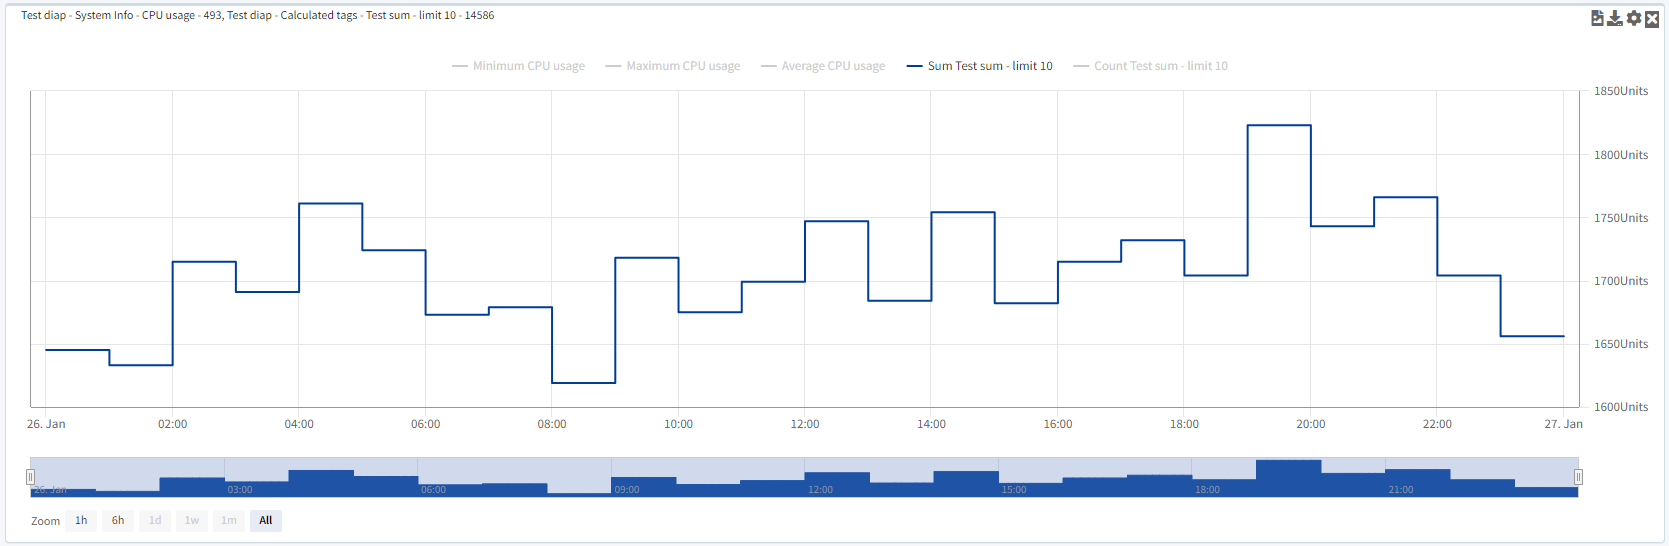
Example is showing sum of all readings for each hour from the week before.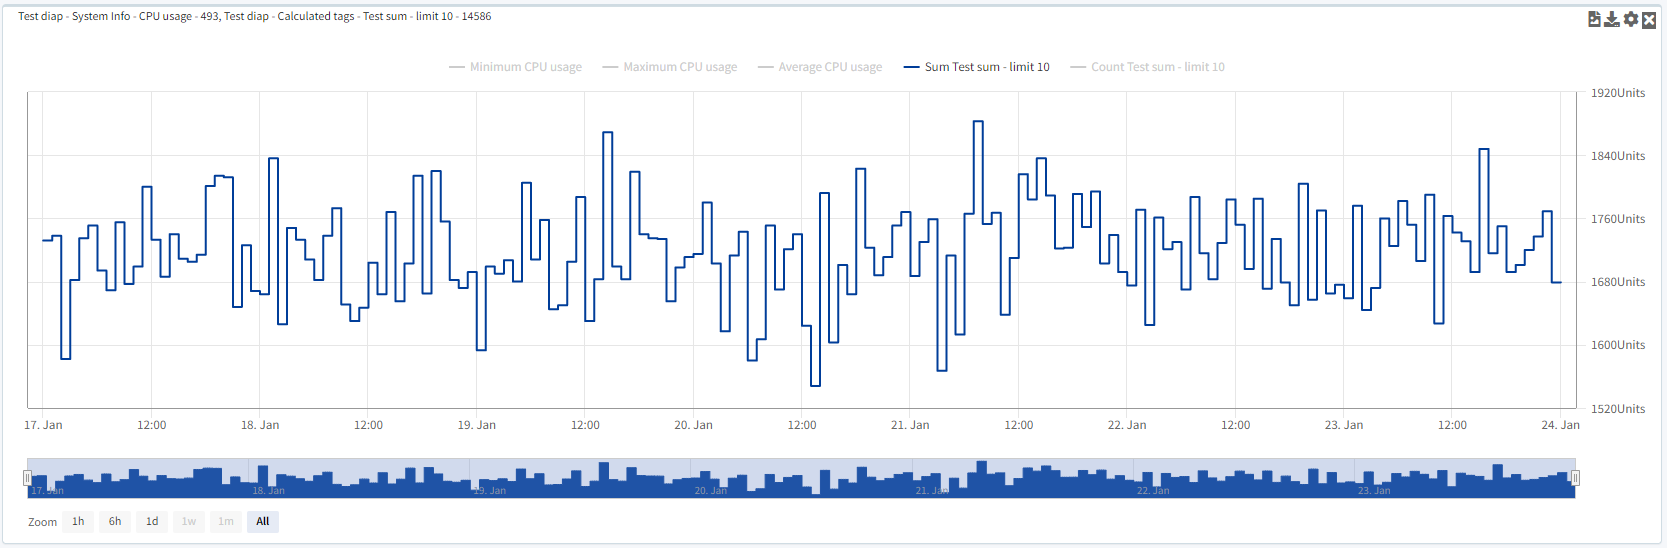
- It is now possible to determine a global date from within the Main dashboard viewer. This makes it possible to have multiple graphs within a dashboard and wishing to see all data from a certain date to another date.
Function can be found under Main -> Selecting next to the selected dashboard.
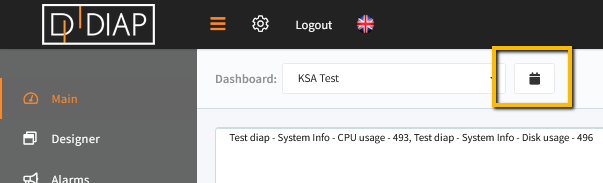
After pressing the button, then a window will popup and enable to the possibility to select a from and to date, where after the data within the selected dashboard will adapt to this date selection.
Note: This will only work on widgets that has a current functionality set to look into historical data. Real-time widgets will not be altered by using this.
Depending on the browser then it may be required for you to clear your cache in order to see the latest functionalities.
If there are any questions to this update, then please contact support@dataintel.dk.